Usage Analytics
Analytics
View detailed metrics for your Enterprise Account and gain insights into token and user usage
Table of contents
Administrators have the ability to view detailed token usage metrics for their Enterprise Account on the Token Statistics page, found under Analytics in the Admin Panel sidebar. This section covers how Administrators can use these metrics to gain insights into token consumption trends and plan for future token purchases.
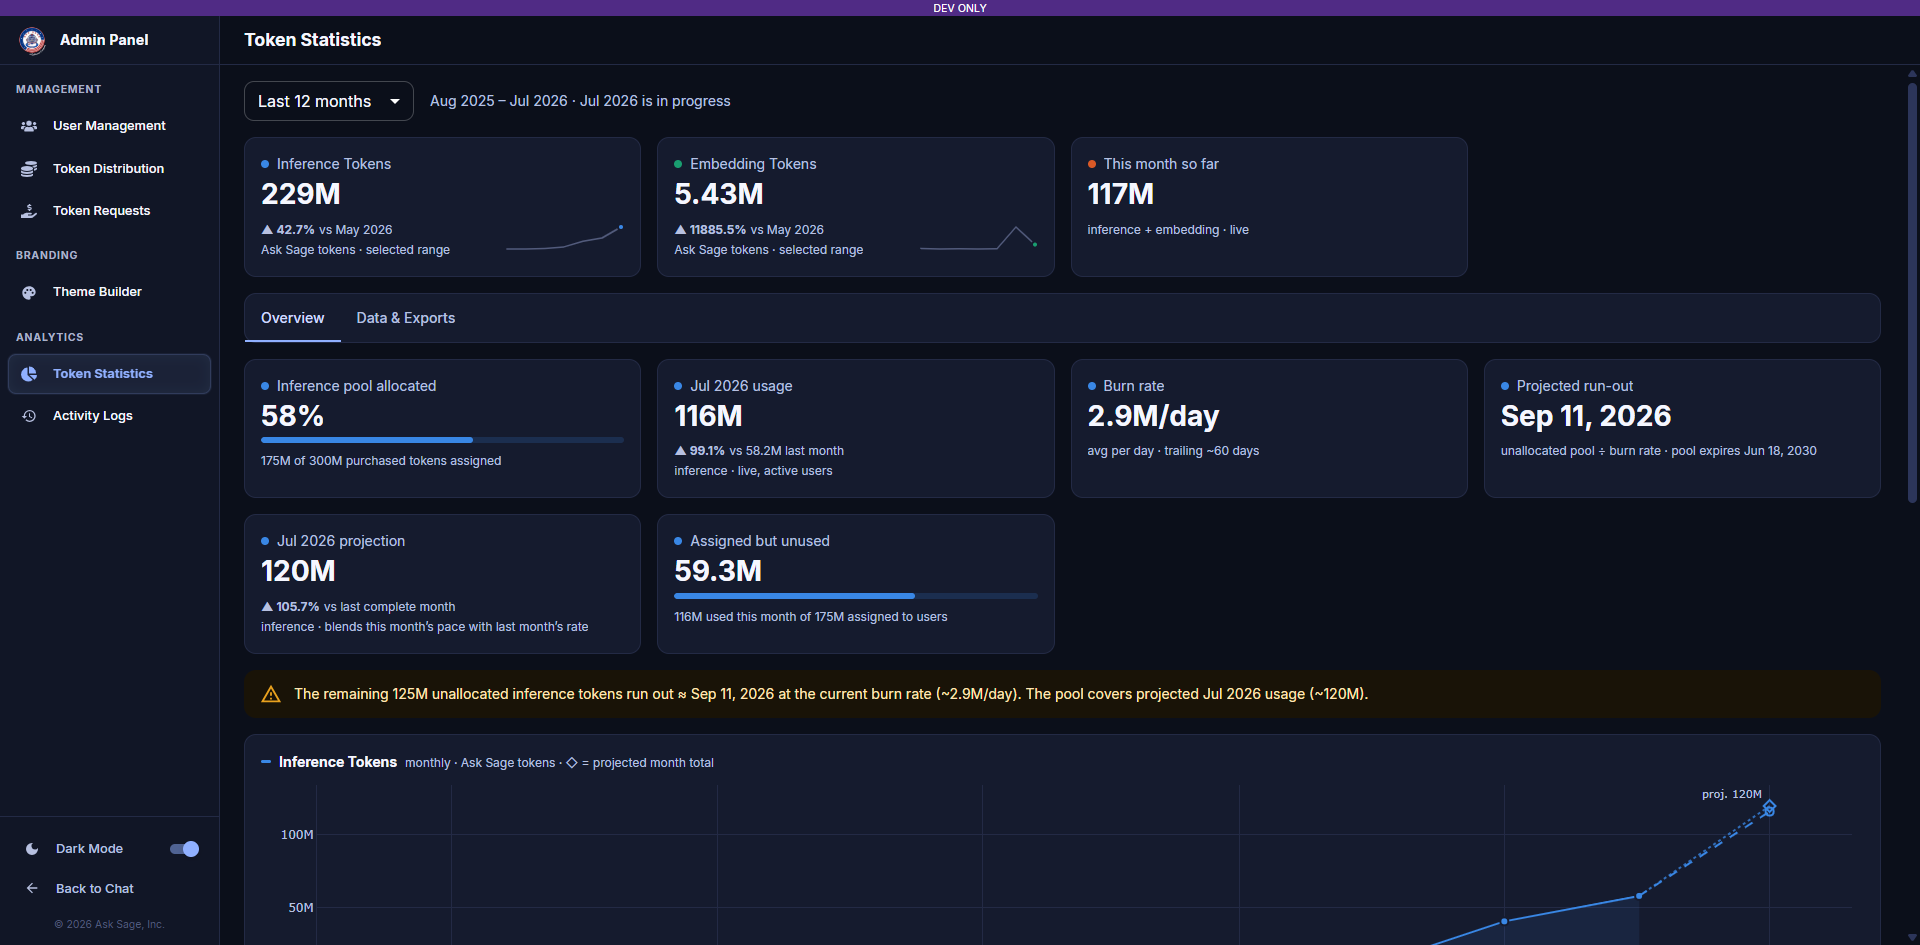
Token Statistics — Overview
Date Range and Summary Cards
Use the date range dropdown (e.g., Last 12 months) at the top of the page to control the window used by the charts and tables below. The selected range and its current status (e.g., "in progress" for the current month) are shown alongside the dropdown. Three summary cards give a real-time snapshot for the selected range:
- Inference Tokens — total inference tokens consumed in the selected range, with percentage change versus the prior period
- Embedding Tokens — total embedding/training tokens consumed in the selected range, with percentage change versus the prior period
- This month so far — live combined inference + embedding token usage for the current calendar month
Overview Tab
The Overview tab surfaces a set of cards that describe the health of the organization's token pool for the current period:
- Inference pool allocated — the percentage of purchased inference tokens currently assigned to users, with the raw totals shown below the percentage
- [Month] usage — total inference tokens consumed so far in the current month, with percentage change versus the previous month
- Burn rate — the average tokens consumed per day, trailing a recent window (e.g., ~60 days)
- Projected run-out — the projected date the unallocated pool will be exhausted at the current burn rate
- [Month] projection — a projected total for the current month based on pace so far, compared to the last complete month
- Assigned but unused — tokens assigned to users that have not yet been consumed this month
Run-out Warning: When the unallocated pool is projected to run out within the current period, a warning banner appears summarizing the remaining balance, burn rate, and projected run-out date.
Below the pool health cards, monthly bar charts break down Inference Tokens and Embedding Tokens usage over the selected date range, with a dashed marker projecting the current month's total. Each chart is paired with a data table listing the exact monthly figures.
Data & Exports Tab
The Data & Exports tab shows a Monthly token usage table with one row per calendar month, listing Inference Tokens, Embedding Tokens, and the combined Total for that period — making it easy to spot seasonal trends or sudden spikes in usage across the Enterprise Account. 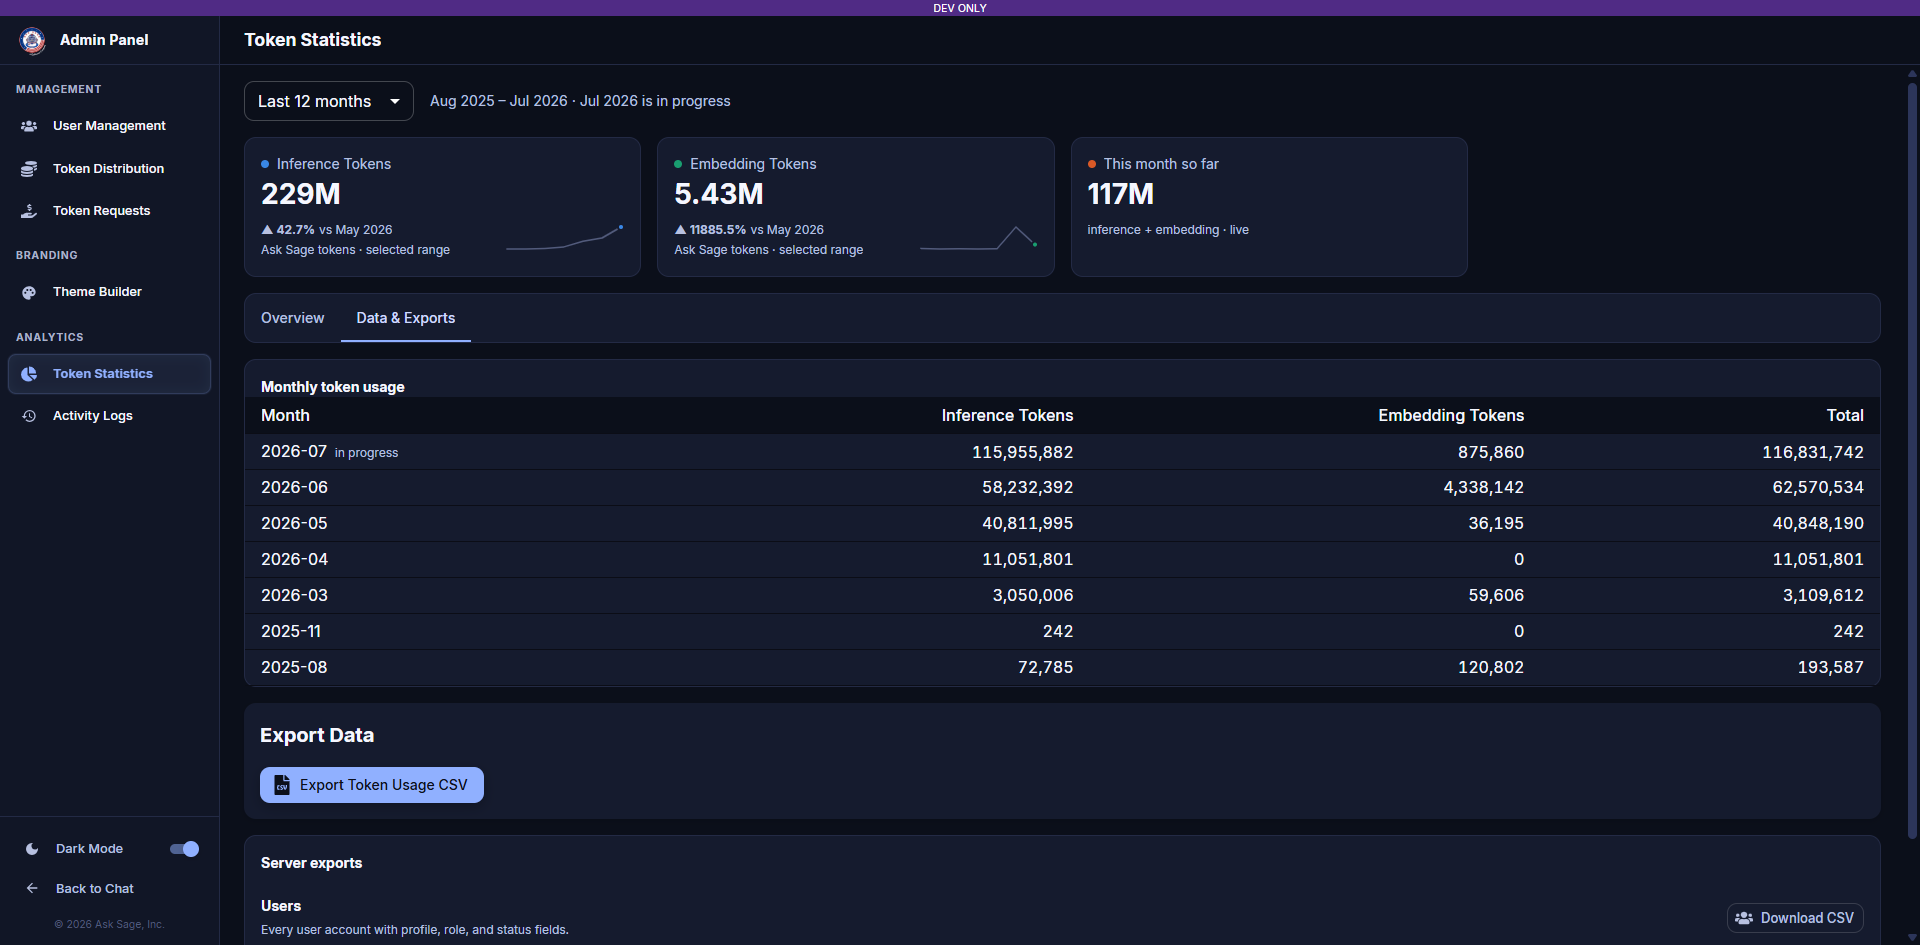
Token Statistics — Data & Exports
- Export Token Usage CSV (Export Data section) — downloads the full historical monthly token usage table as a CSV file, covering both inference and embedding token columns by period
- Download Users CSV (Server exports — Users) — downloads every user account with profile, role, and status fields
- Download Users with Tokens CSV (Server exports — Users with Tokens) — downloads user accounts along with their token assignments and usage, useful for audits or sharing usage reports with stakeholders
Activity Logs
Administrators can view the Activity Logs for each user in the Enterprise Account from the standalone Activity Logs page, found under Analytics in the Admin Panel sidebar. The Activity Logs provide a detailed history of the user's interactions on the platform, including the number of tokens consumed, the type of interactions, the date and time of interactions, IP address, and other relevant details. To access the Activity Logs for a specific user, click the three-dot menu to the left of that user in the User Management table and select View Logs. Each entry includes the prompt text (truncated), the model used, Prompt Tokens, Completion Tokens, Total Tokens for that interaction, and a Training flag indicating whether the response involved a dataset ingestion.
Tip: Use the three-dot menu -> View Logs for a specific user to access detailed interaction history and token consumption details.