Use Cases & Examples
Real-world workflows and templates you can download and use today
Table of Contents
- PowerPoint Generator — Transform source documents into professional, downloadable .pptx files
- CSV Data Query — Enrich every row of a spreadsheet with AI-generated analysis
- Proposal Evaluation Agent — Score RFPs and auto-route to pursuit plans, risk assessments, or decline packages
Each example below is fully documented, includes sample outputs, and ships with a downloadable JSON template you can import directly into Agent Builder. More examples are added regularly.
Transform source documents into professional, presentation-ready PowerPoint files — automatically. This multi-step workflow extracts key content from your uploaded documents, suggests enhancements, builds a detailed slide-by-slide outline, and generates downloadable PowerPoint code — all in a single run.
How It Works
The workflow chains together four AI-powered stages, each building on the last:
.pptx file with professional formatting. Workflow Overview
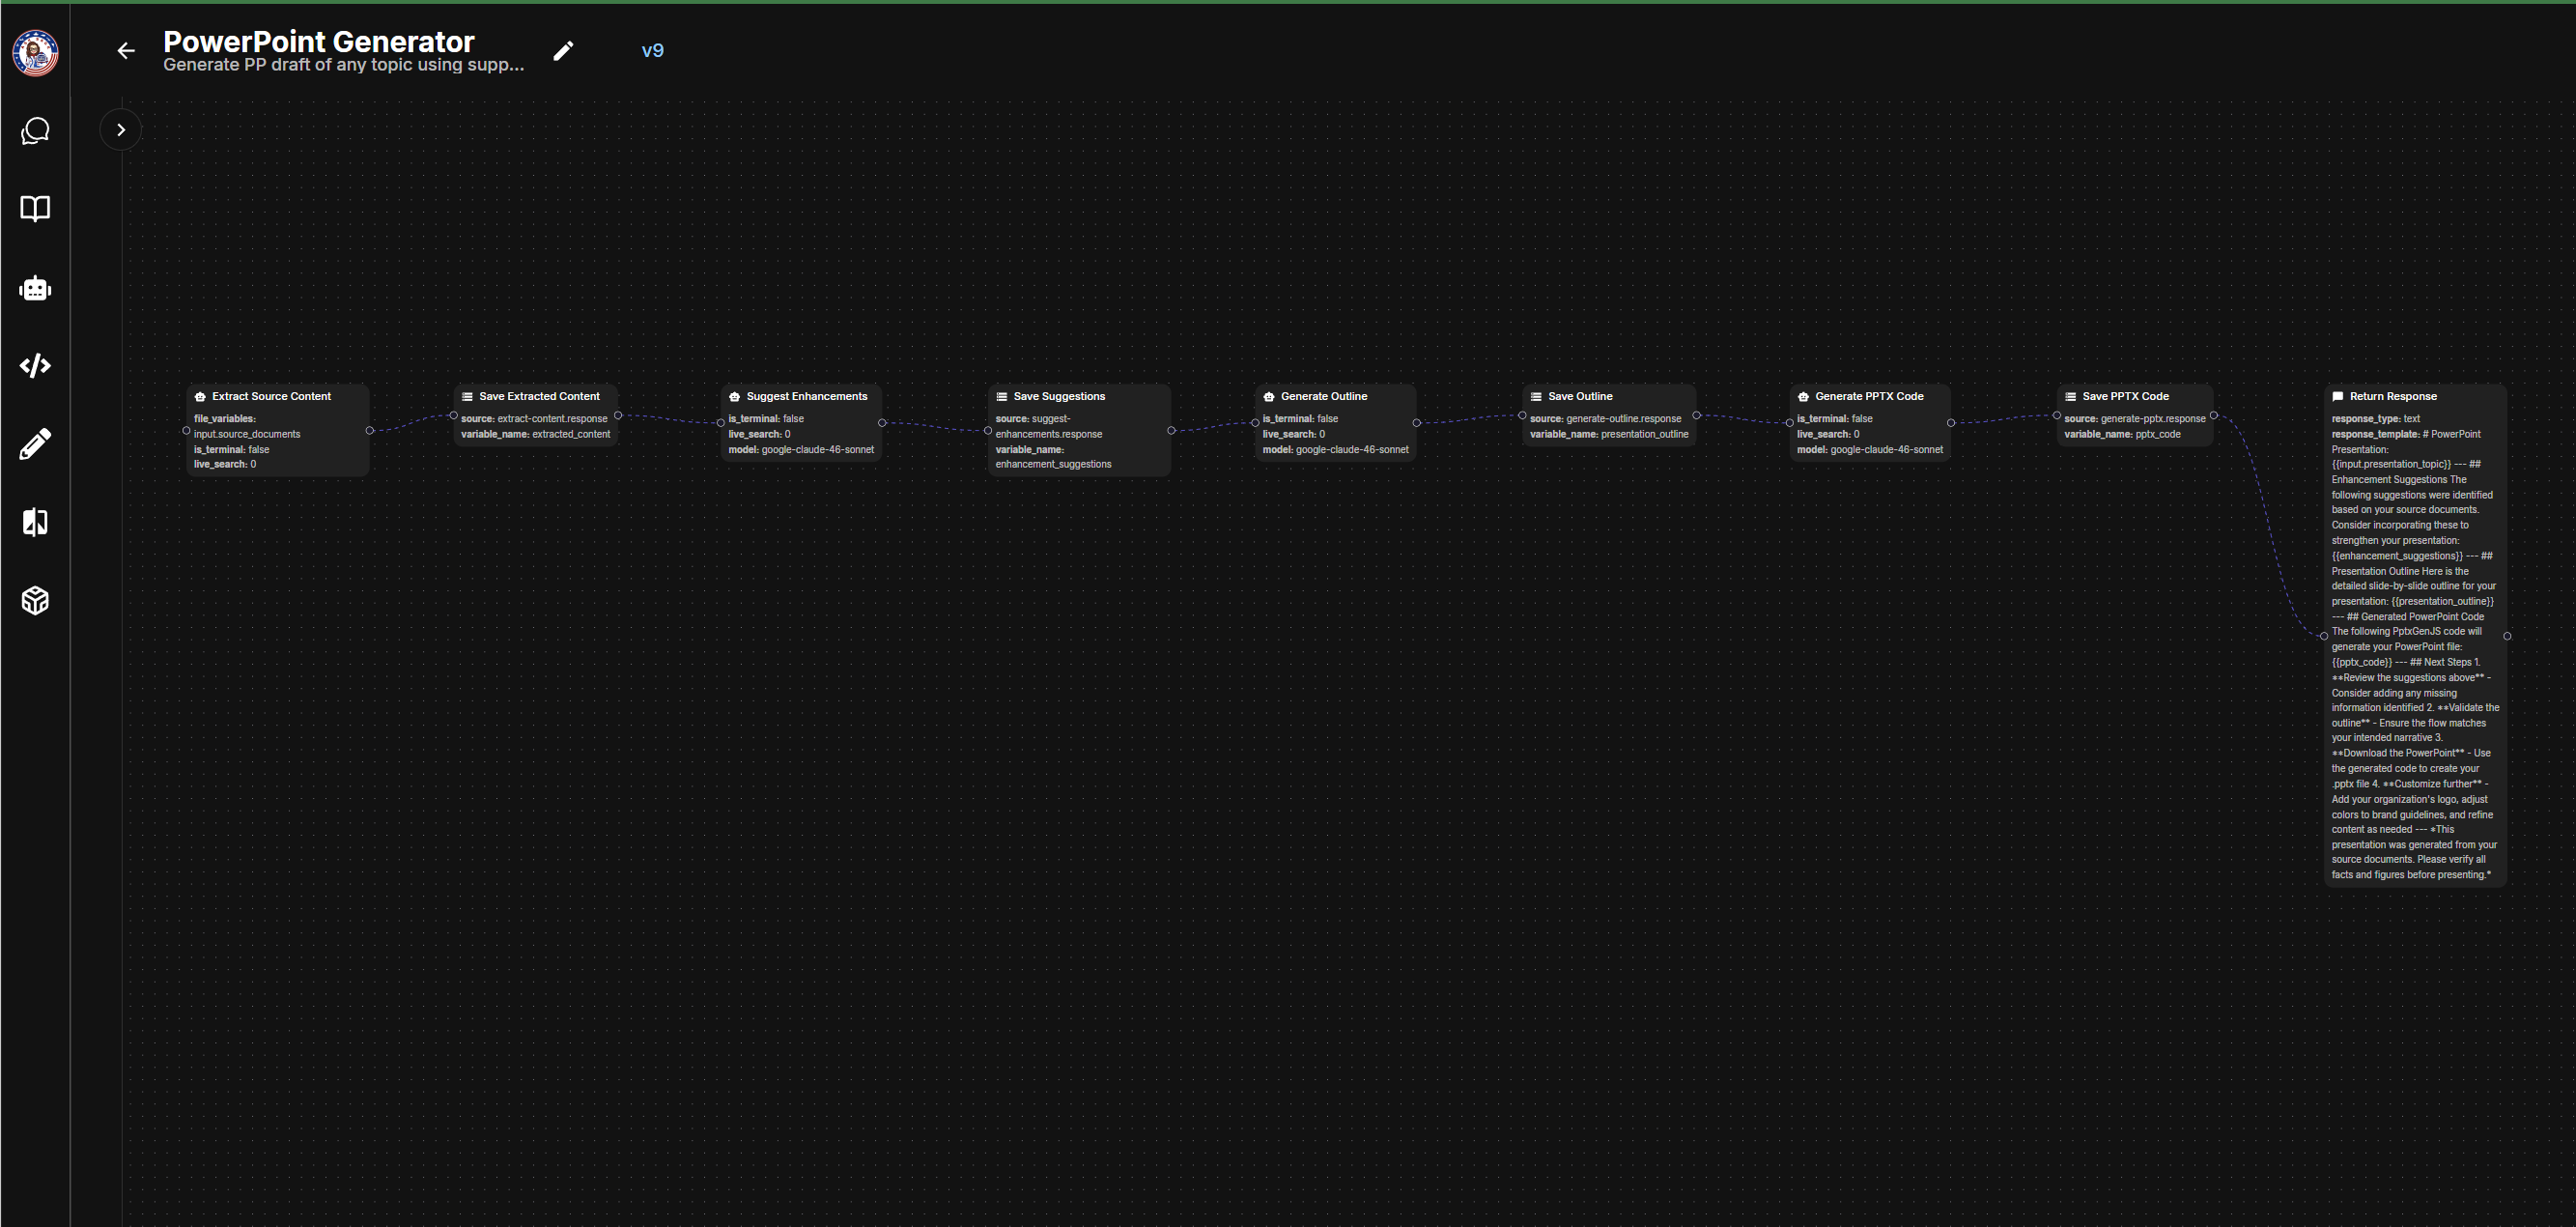
Below is the full node flow inside the Agent Builder. Each node passes its output to the next, creating a seamless pipeline from raw documents to finished slides.
Sample Output
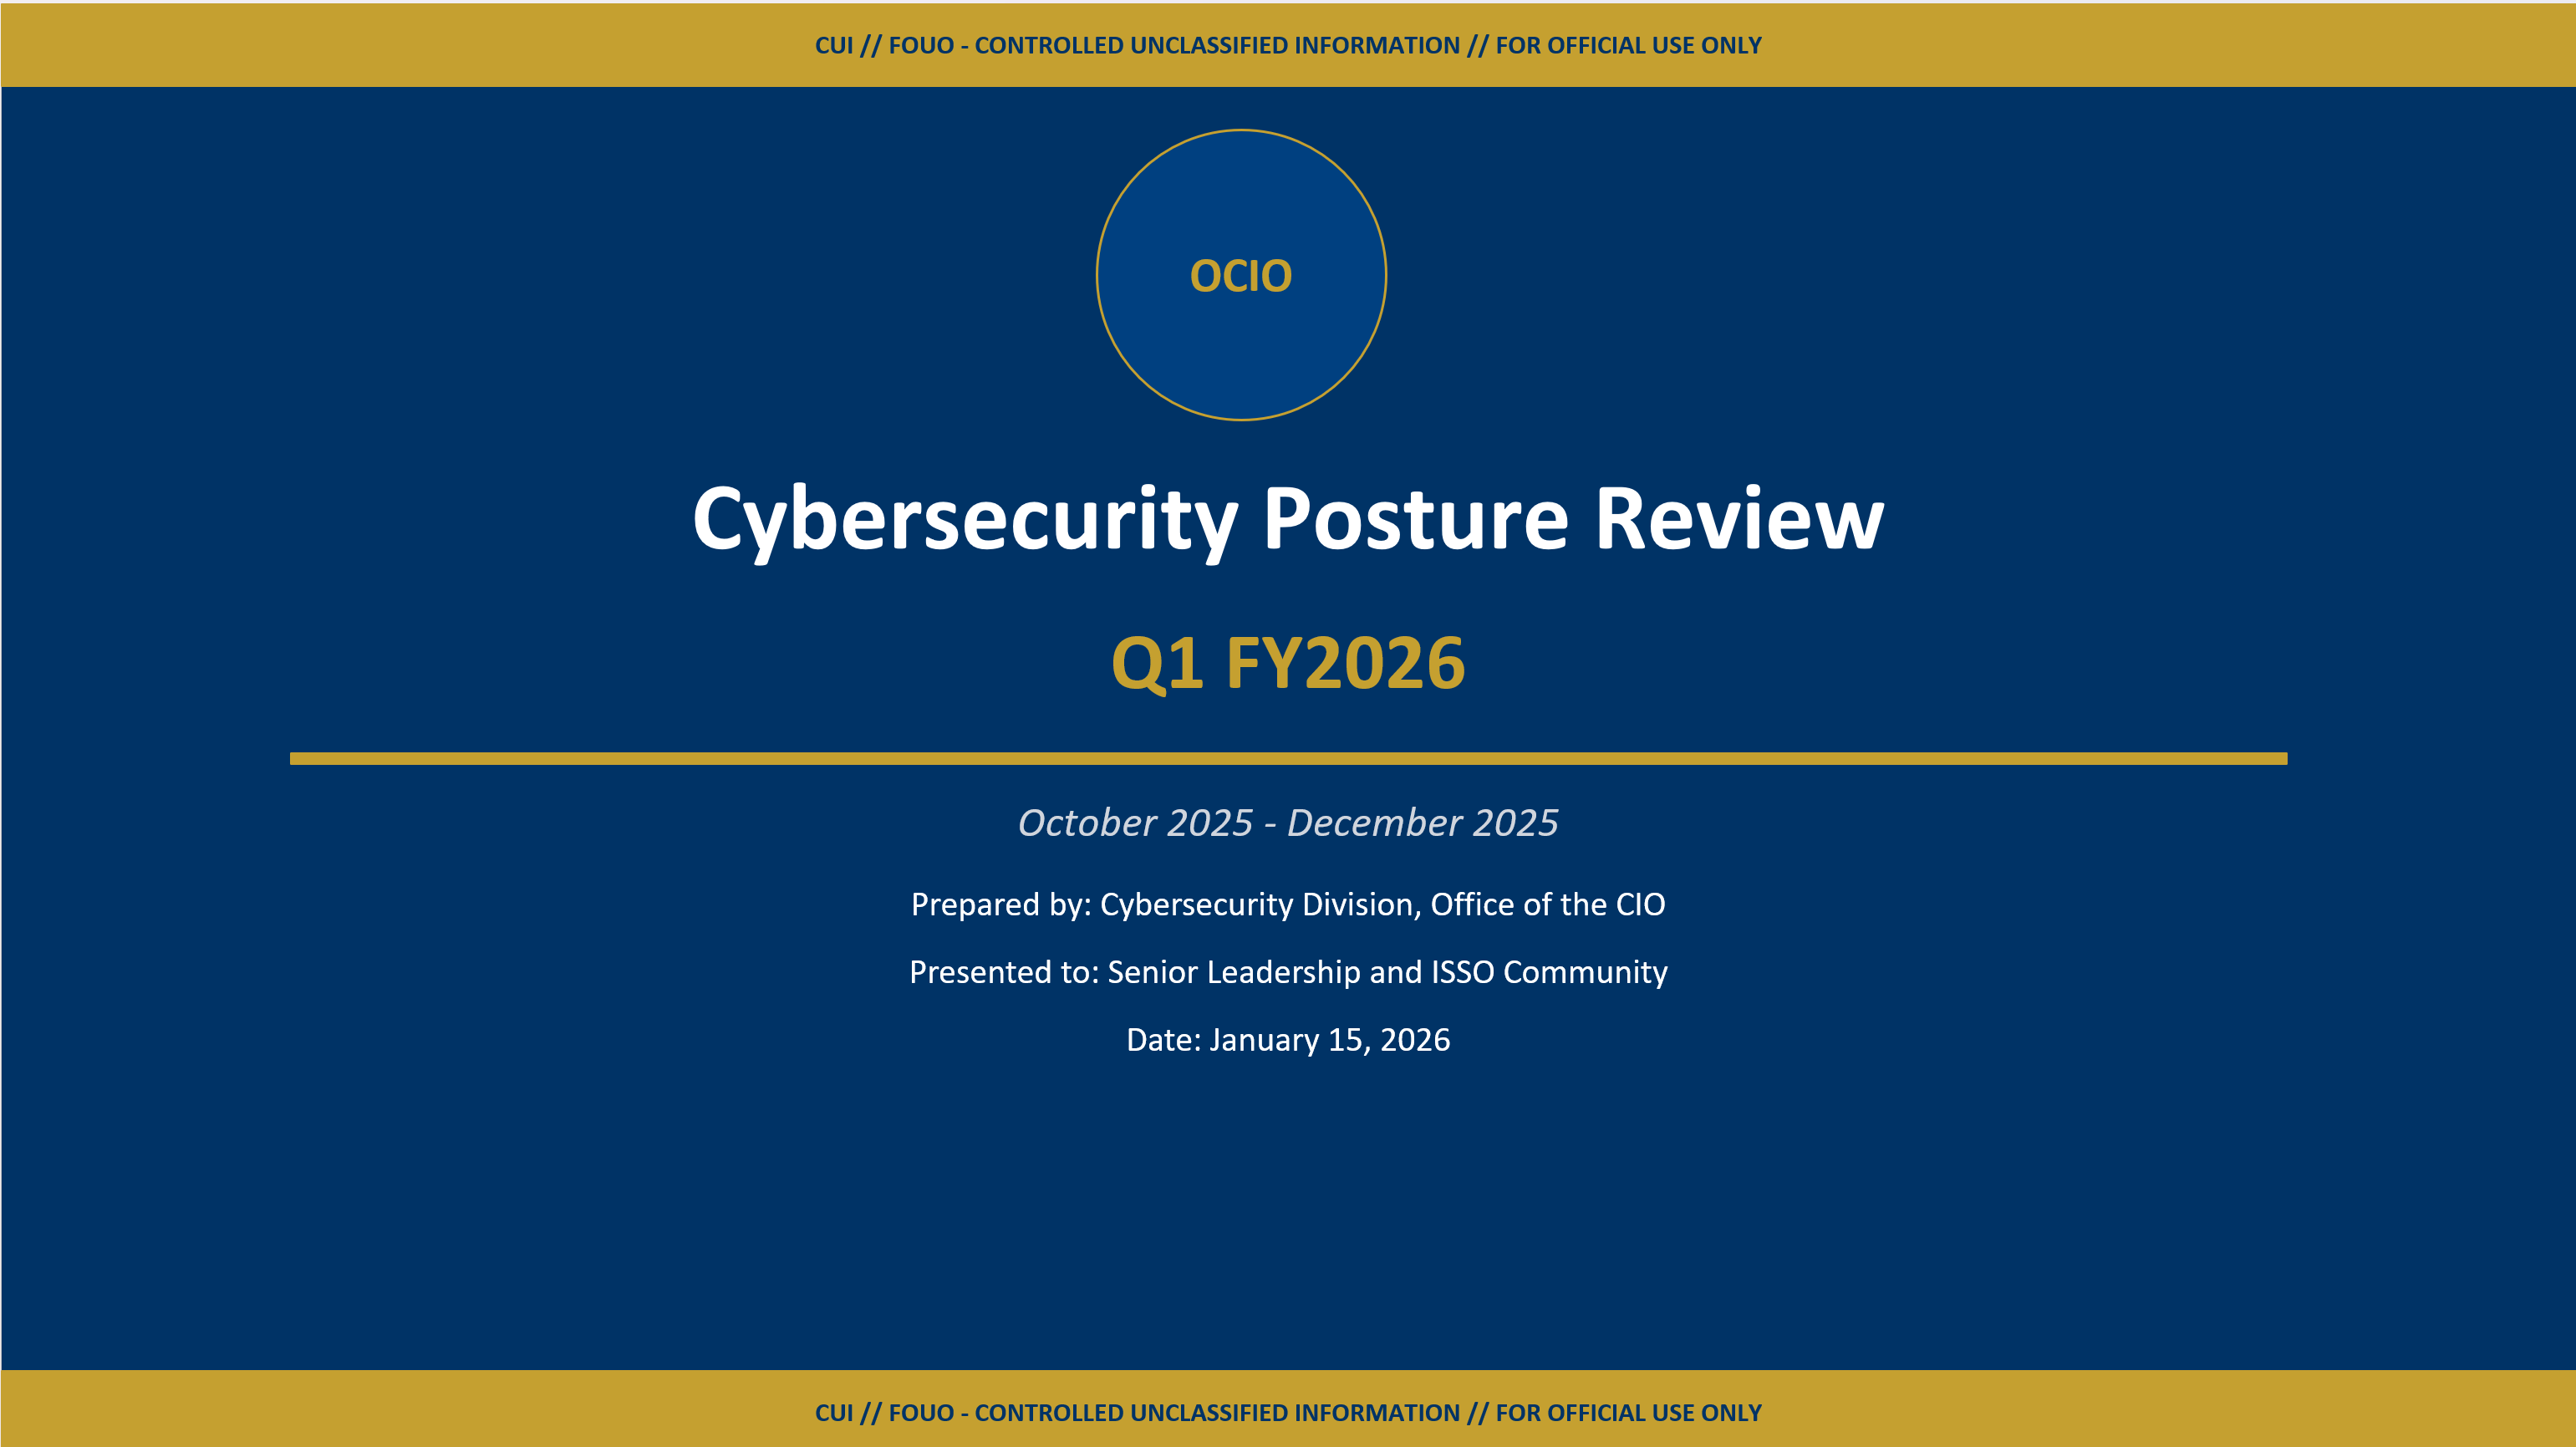
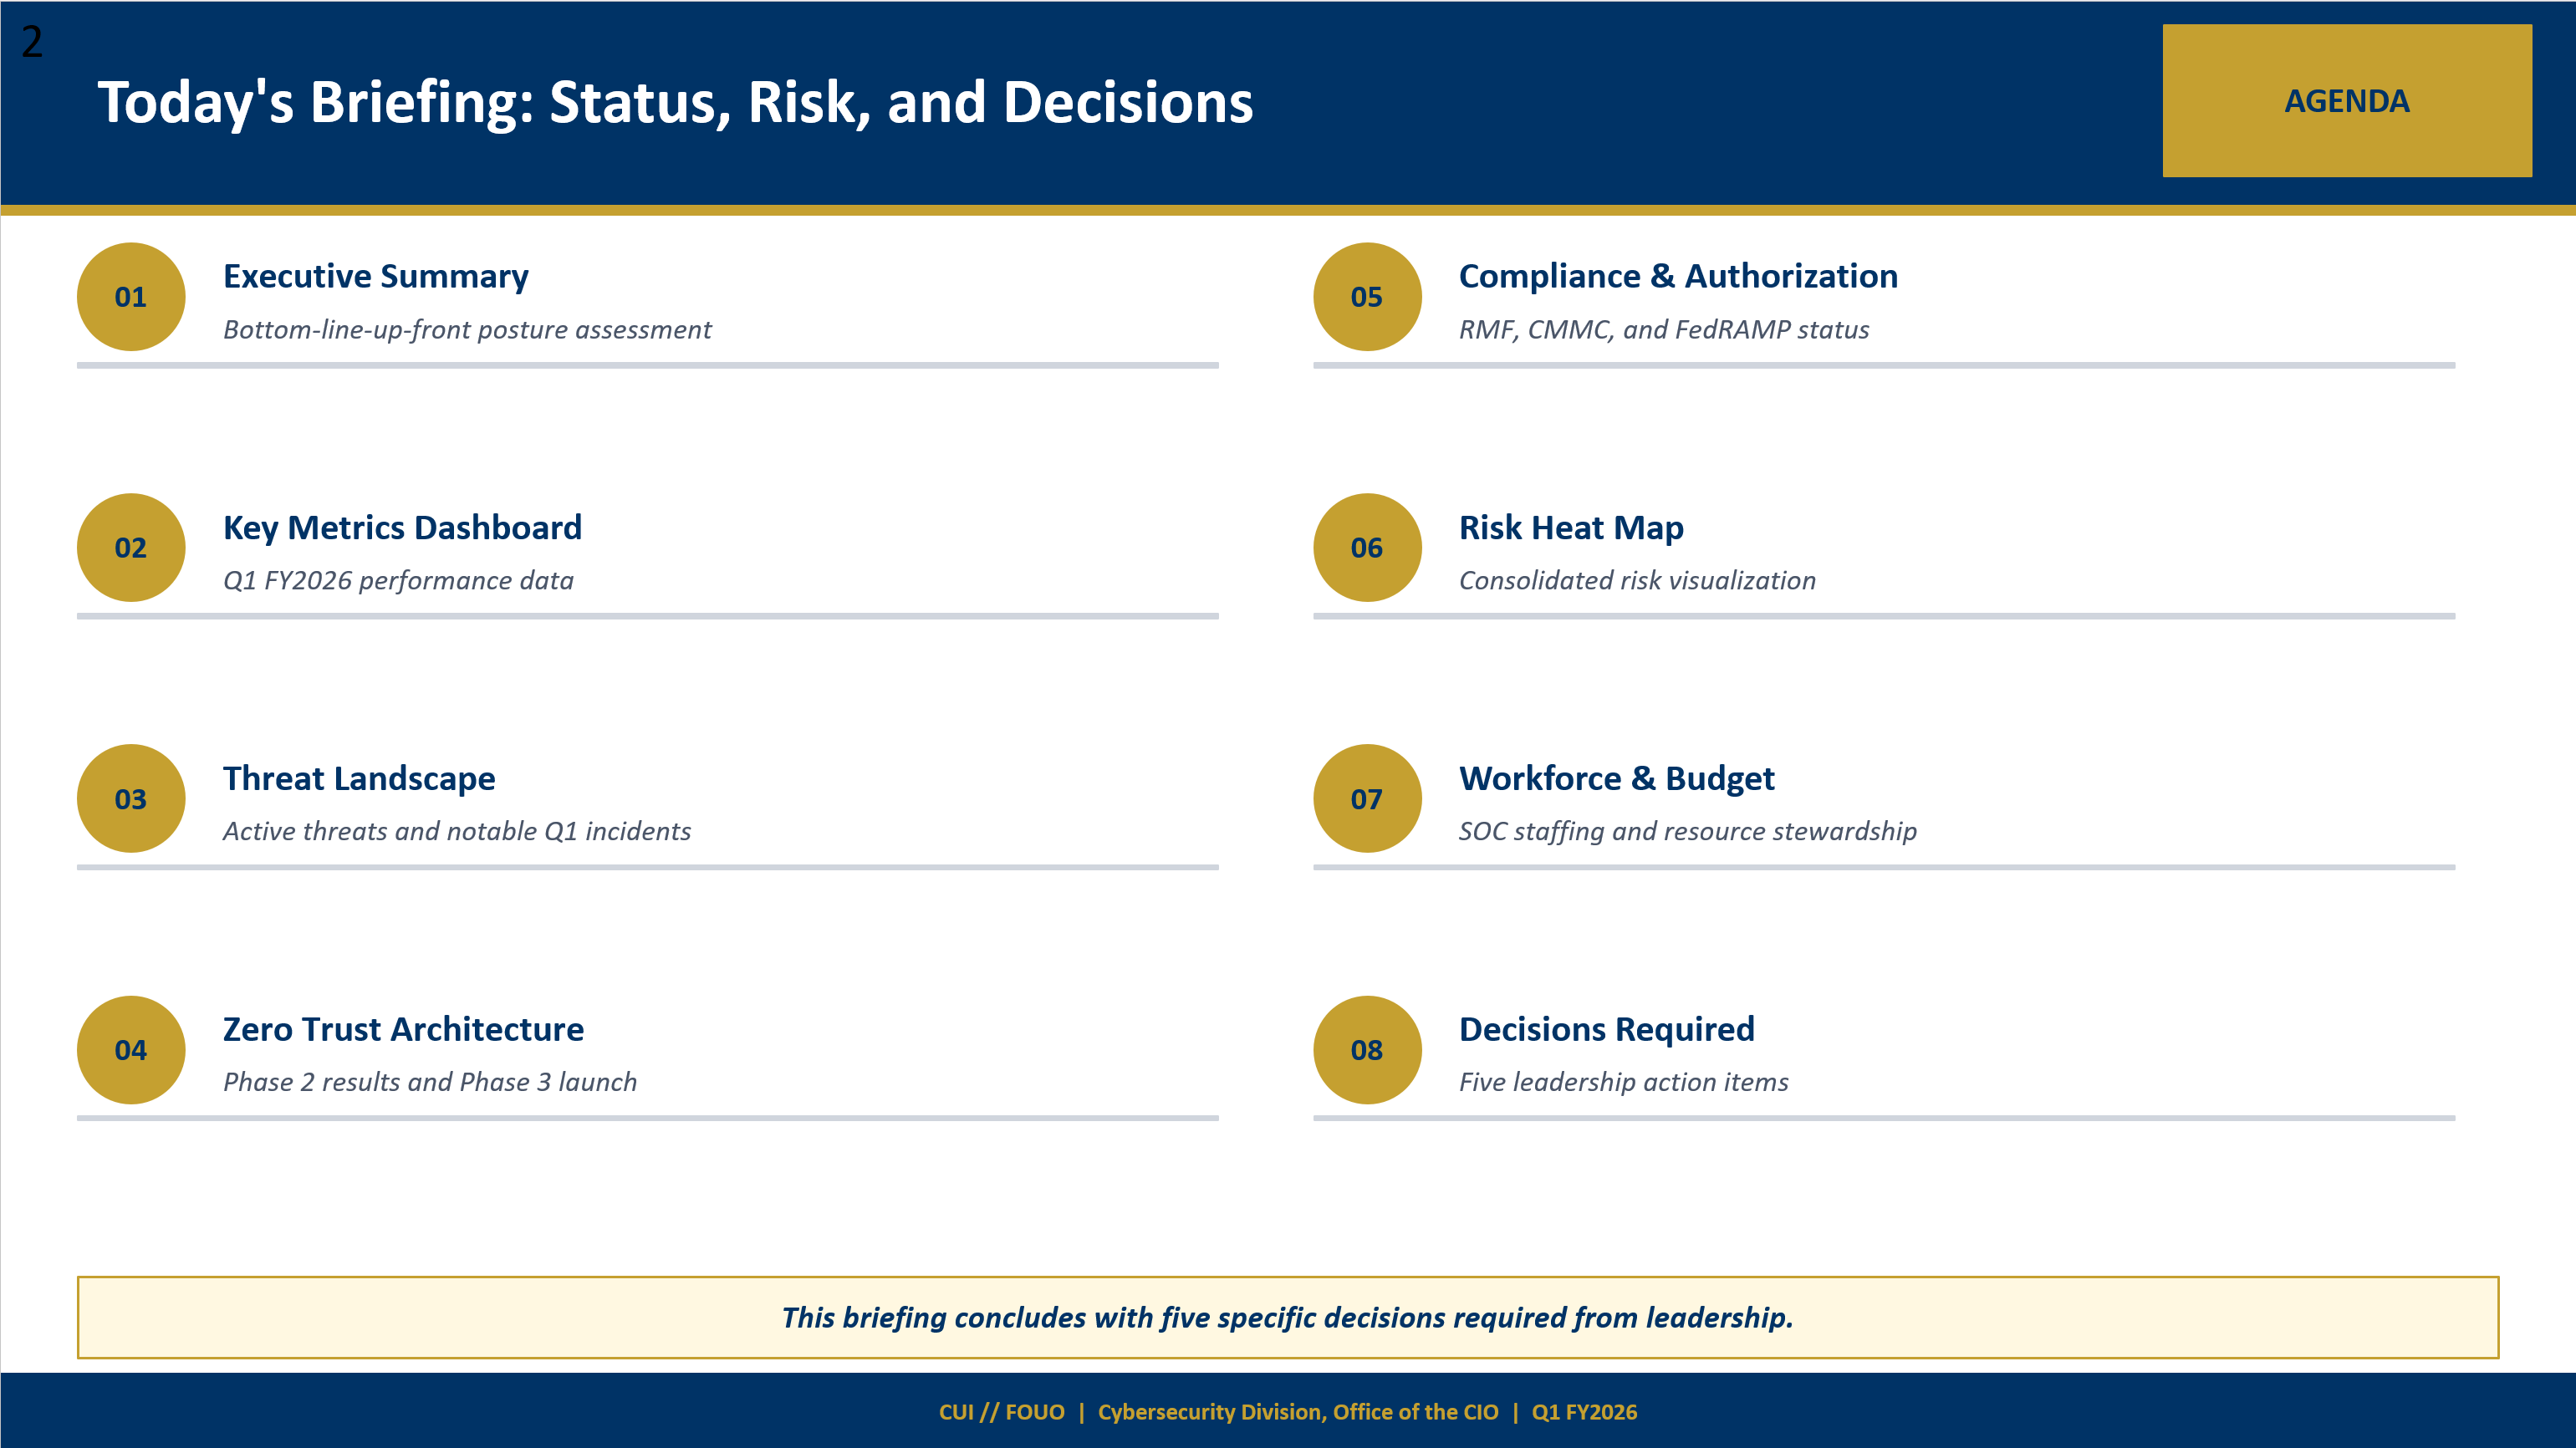
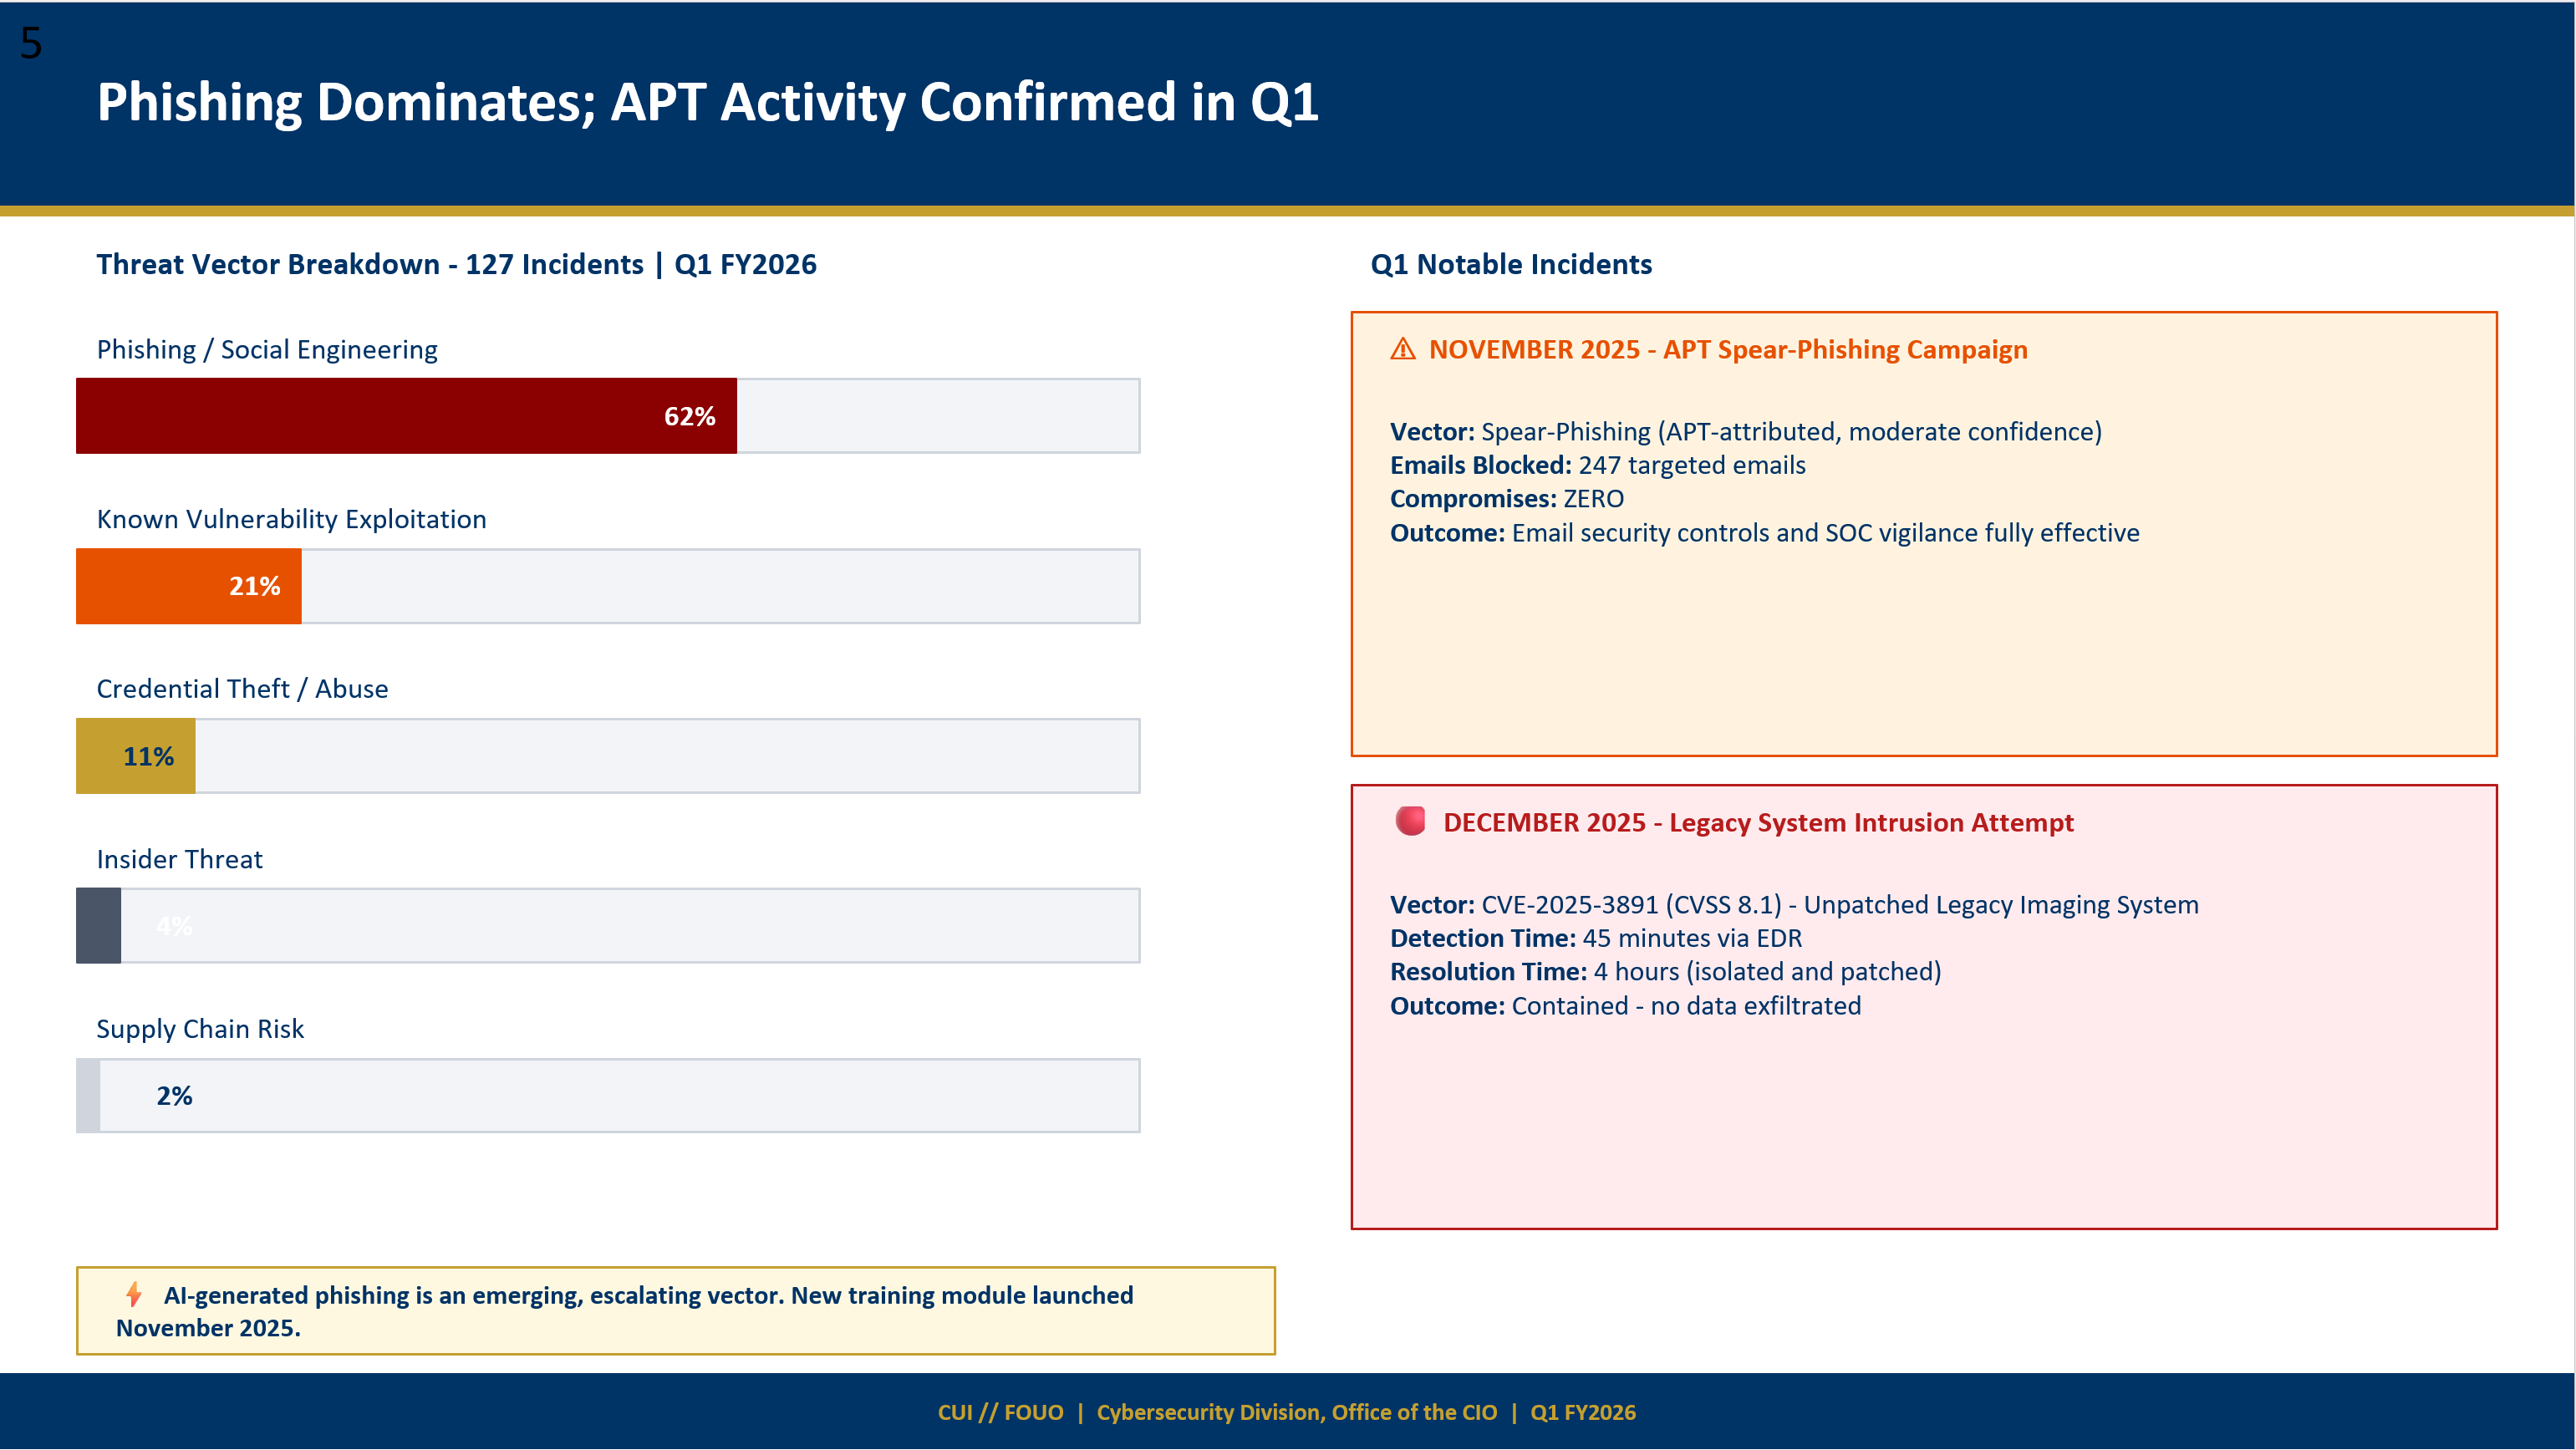
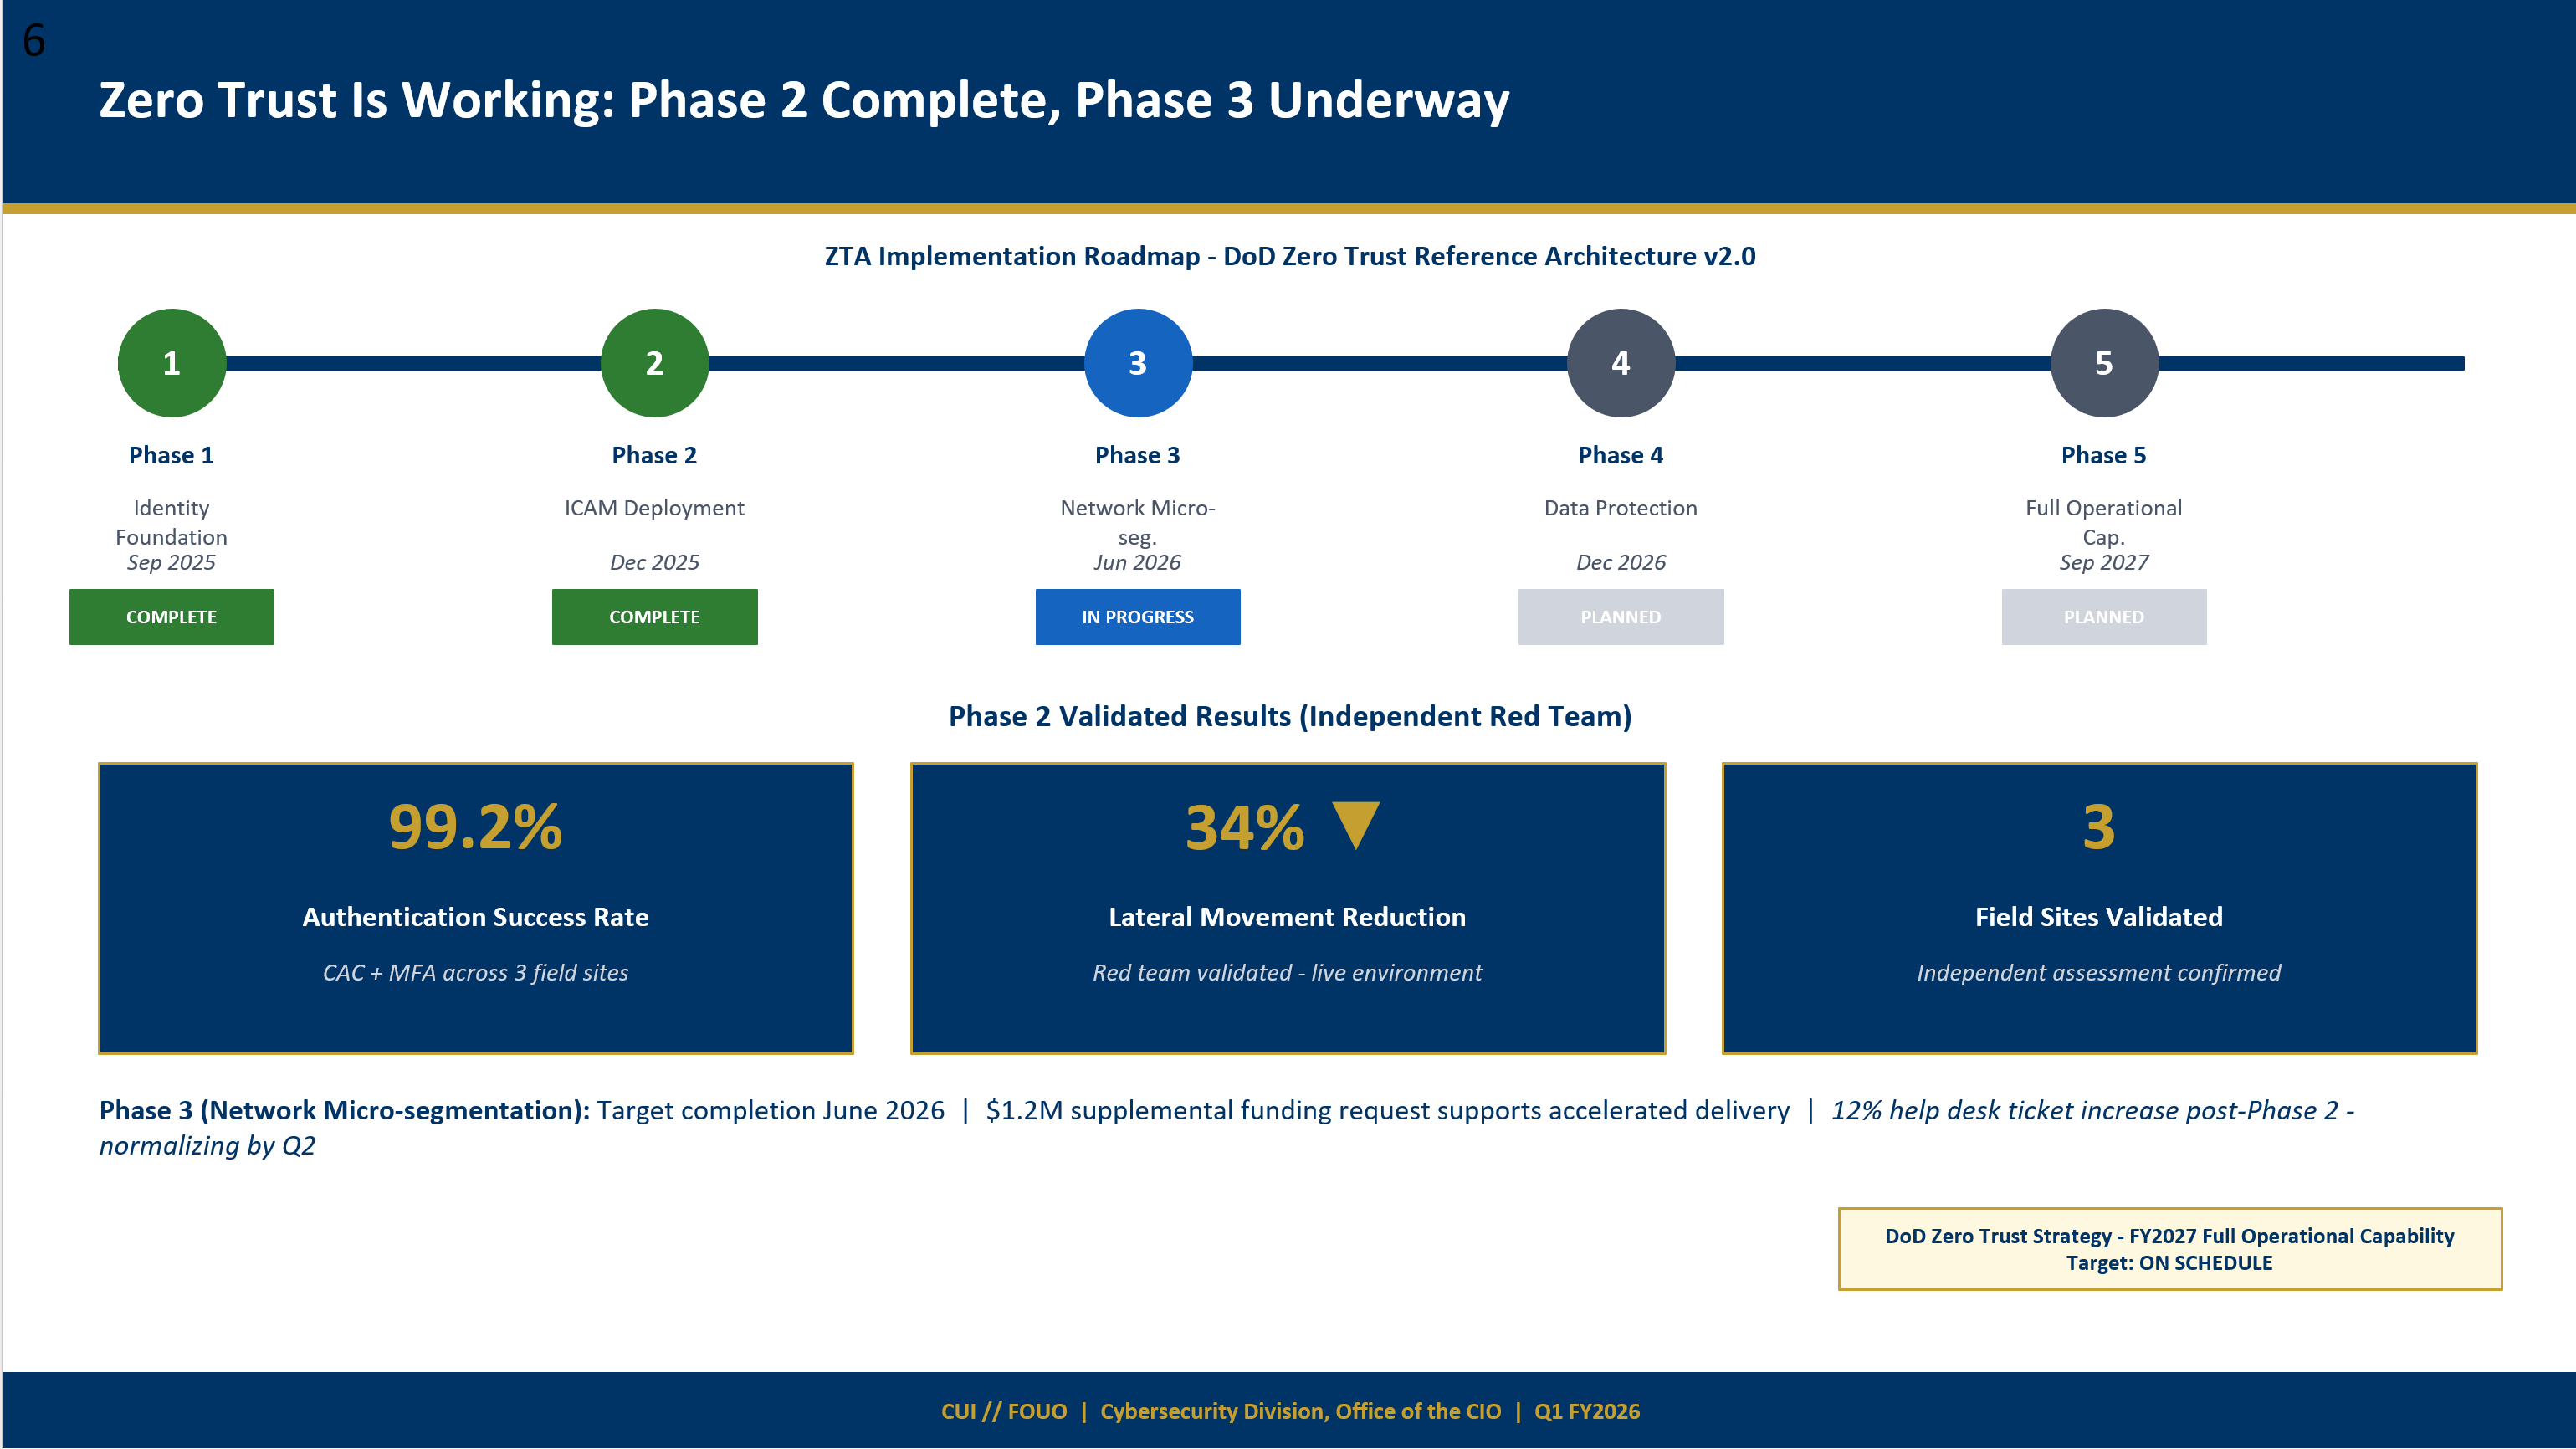
Here is an example presentation generated from a cybersecurity posture review — the workflow produced a complete 12-slide briefing deck with data visualizations, executive summaries, and a Zero Trust roadmap, all from source documents alone.
Presentation Guide
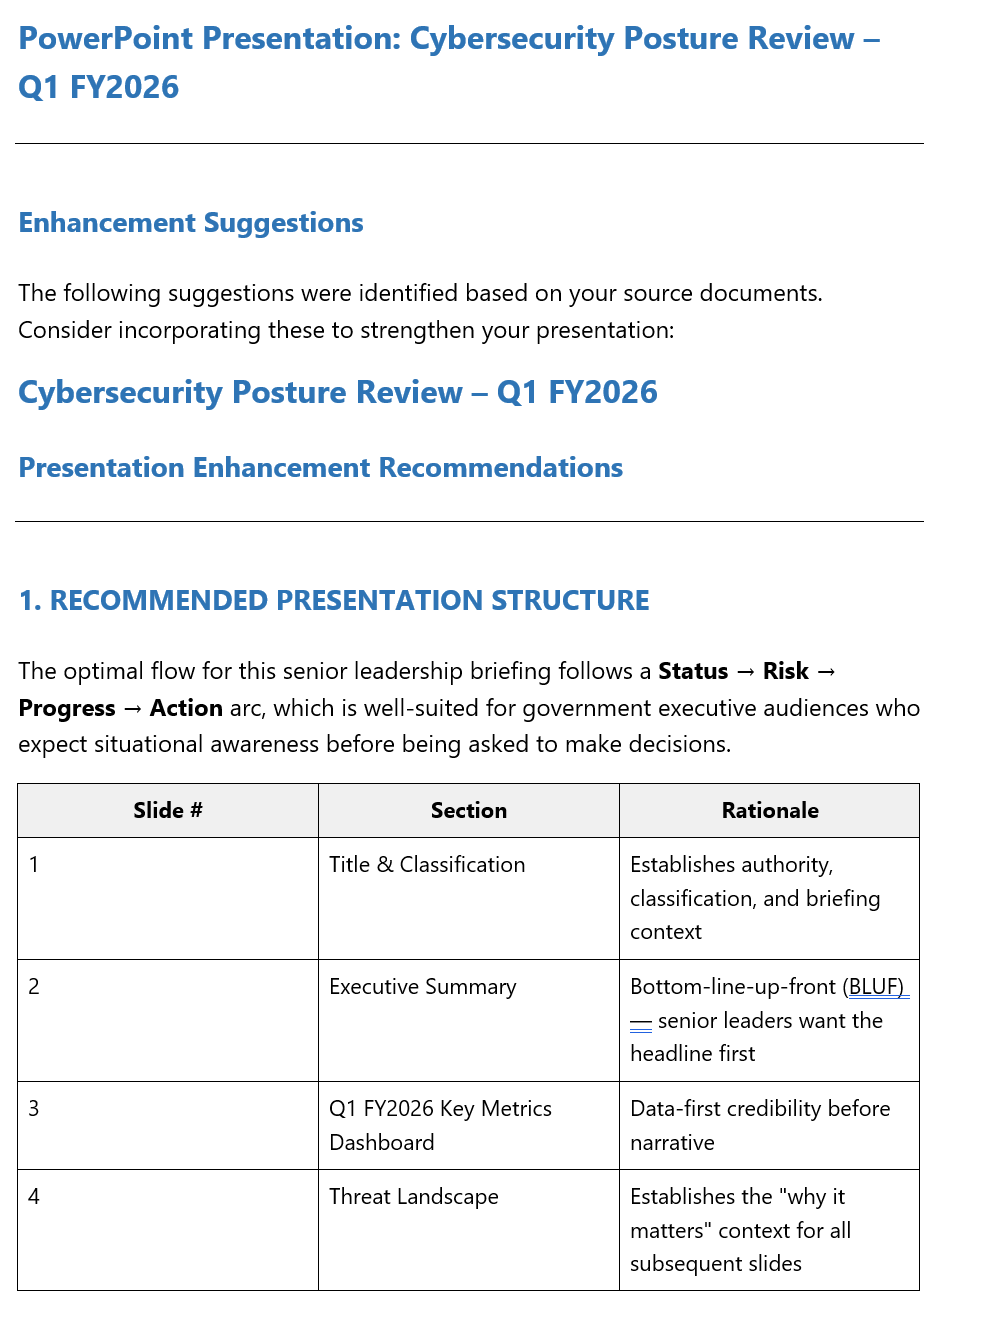
In addition to the slides, the workflow returns a comprehensive guide with enhancement suggestions, a full slide outline, and next steps — giving you everything you need to review and customize the final product.
Customizable Inputs
The workflow accepts several variables you can tailor to your needs:
| Variable | Description | Example |
|---|---|---|
source_documents | Upload the files you want to turn into a presentation | PDF reports, Word docs, text files |
presentation_topic | The subject of your presentation (or leave blank to auto-detect) | Cybersecurity Posture Review — Q1 FY2026 |
audience_context | Who will be viewing the presentation | Senior leadership and ISSO community |
slide_count | Target number of slides | 12 |
style_preferences | Color scheme, fonts, and design direction | Navy blue (#003366), gold accent, minimal design |
additional_instructions | Any extra guidance for the AI | Include a Zero Trust slide; end with Decisions Required |
Turn raw spreadsheet data into actionable insights — row by row. This workflow loops through every row of an uploaded CSV, runs an AI analysis on each record individually, appends a new column with the findings, and then produces an overall portfolio-level summary. Upload any dataset and define what you want analyzed — budget execution, compliance posture, operational performance, or anything else.
How It Works
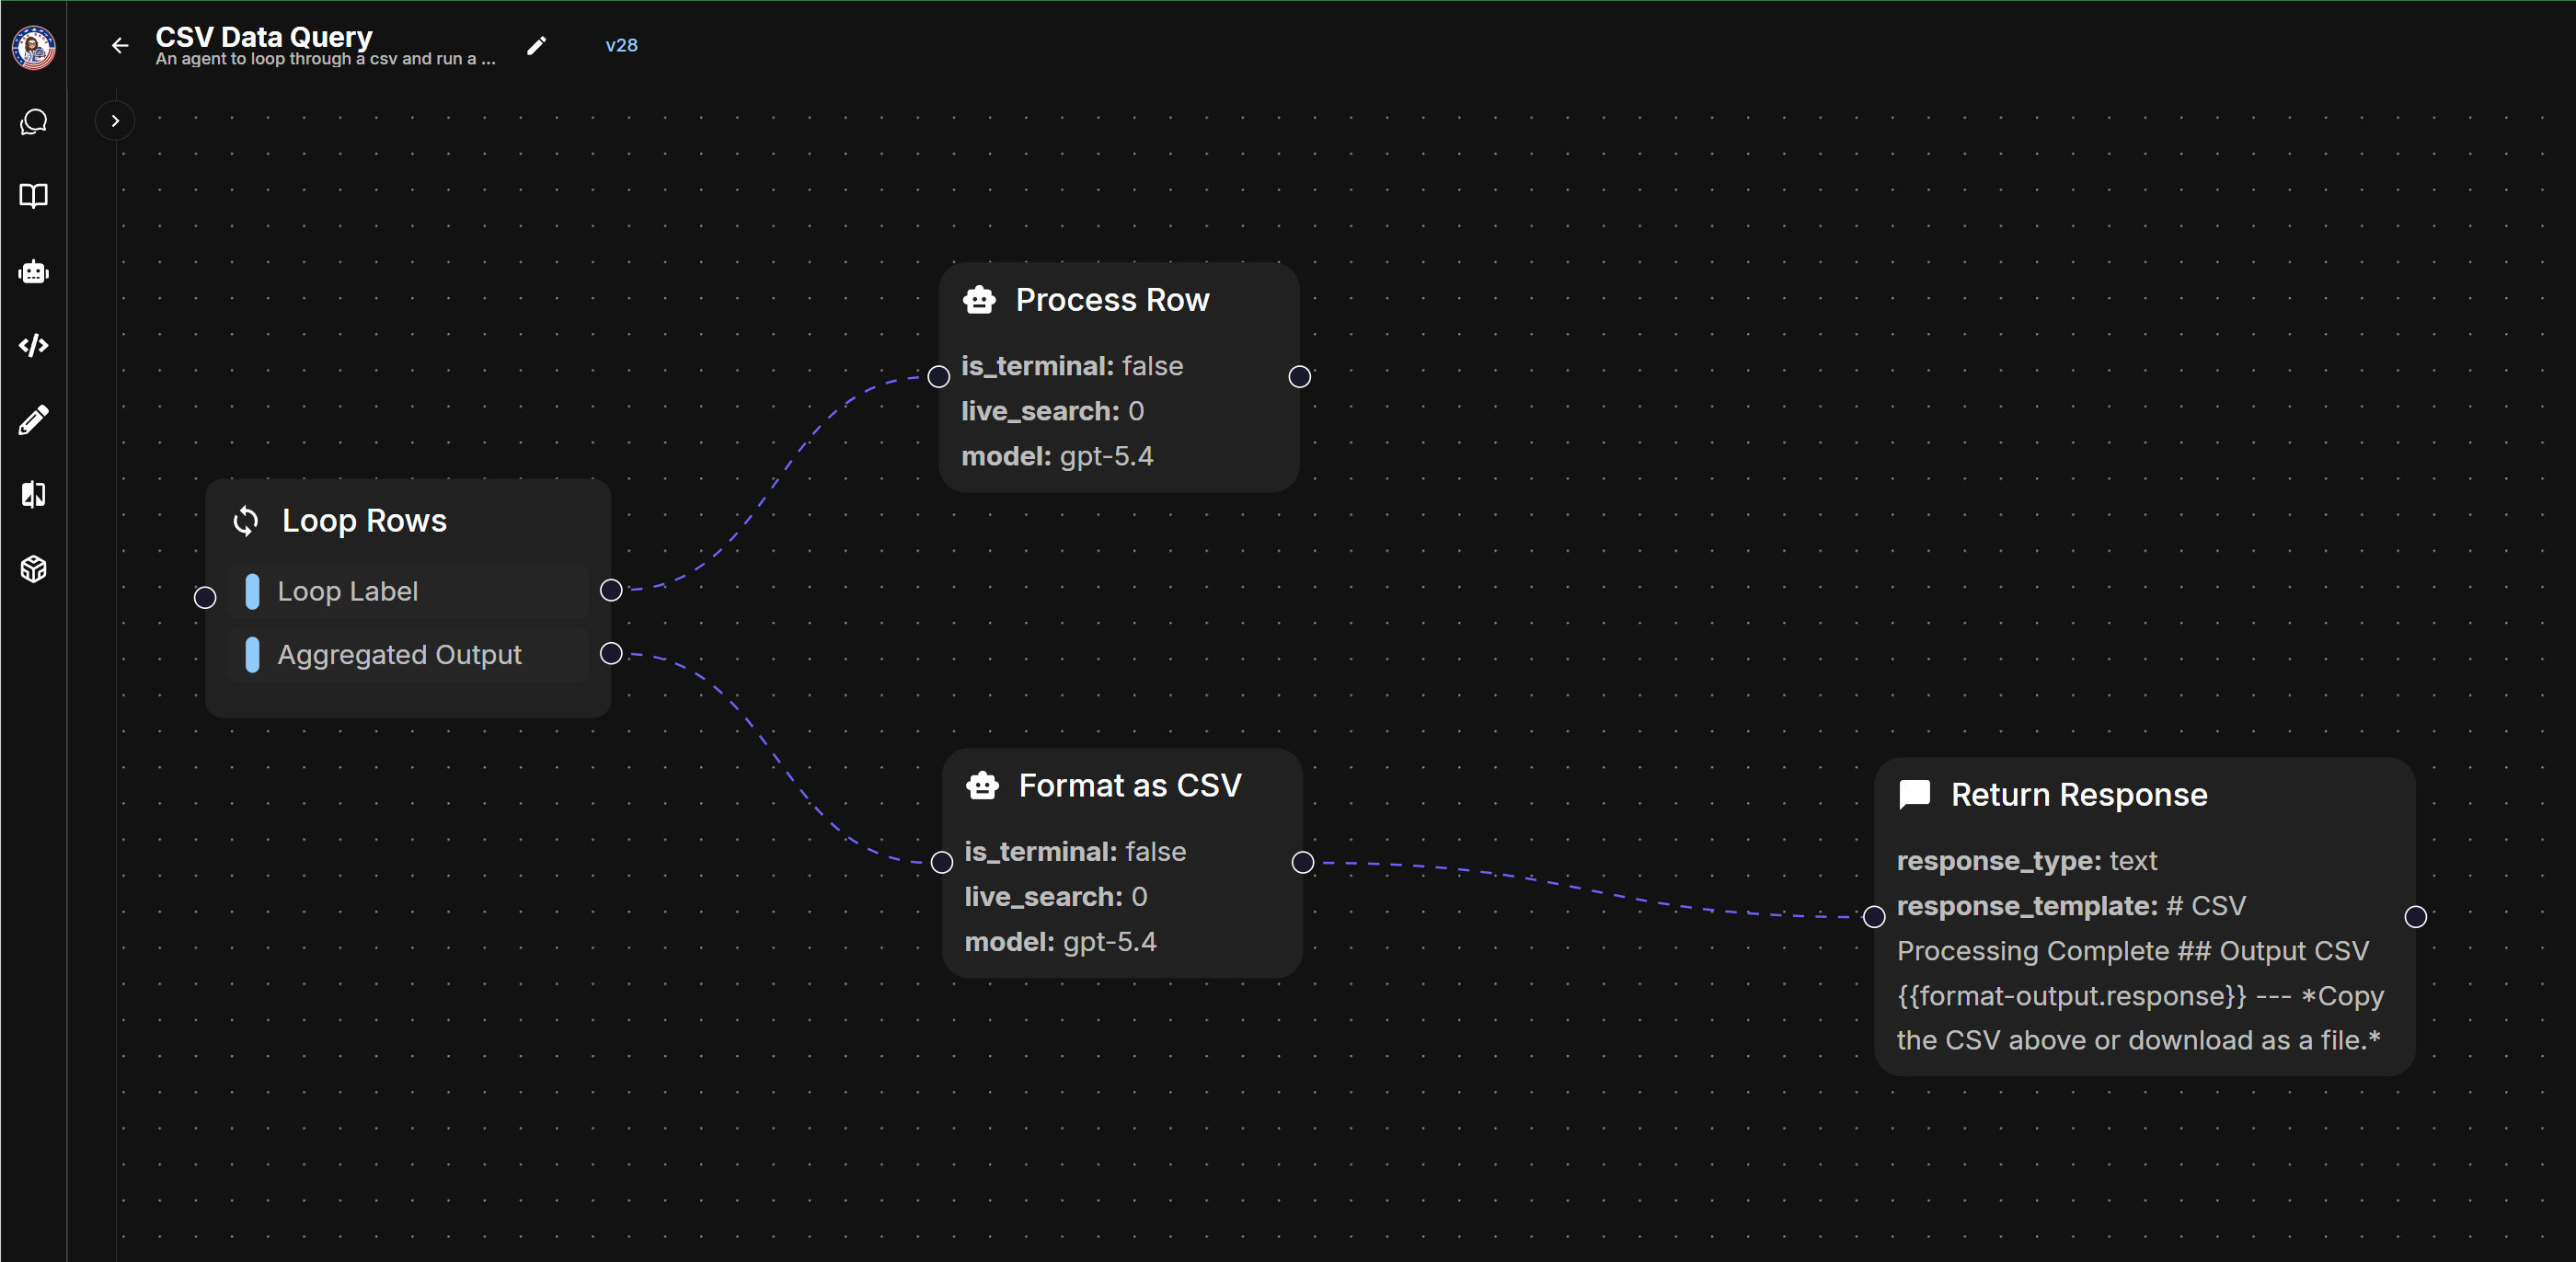
The workflow uses a Loop node to iterate through each row of the CSV, running an LLM analysis on every record before reassembling the results into an enriched dataset.
Analysis column into a clean CSV format ready for download. Workflow in Agent Builder
Sample Enriched Output
Below is a sample of the enriched CSV — the original data columns are preserved and a new Analysis column is appended with a per-row assessment. Click Show All Columns to reveal the full dataset, or view the condensed version with just the facility identifiers and analysis.
| Facility Name | Region | Division | FY2025 Enacted | YTD Obligations | YTD Expenditures | Unliquidated | Unobligated Bal. | FTEs Auth. | FTEs Onboard | Outsourced Svc. | Direct Svc. Vol. | Analysis |
|---|---|---|---|---|---|---|---|---|---|---|---|---|
| Aurora Medical Center | Southwest | Division A | 200,000,000 | 182,000,000 | 165,000,000 | 17,000,000 | 18,000,000 | 1,500 | 1,380 | 22,000 | 410,000 | Facility demonstrates disciplined budget execution with 91.0% obligation rate and 90.7% expenditure rate. Staffing fill rate is 92.0% with outsourced leakage controlled at 5.4% of service volume. Operating within expected parameters. |
| Bayside Health Complex | Southeast | Division C | 130,000,000 | 119,600,000 | 108,500,000 | 11,100,000 | 10,400,000 | 1,100 | 1,005 | 15,000 | 285,000 | Solid financial management with 92.0% obligation rate and 90.7% expenditure rate. Staffing fill rate of 91.4% is near target. Outsourced services at 5.3% suggest manageable contractor dependency. No significant anomalies identified. |
| Bravo Regional Hospital | West | Division B | 200,000,000 | 190,000,000 | 174,800,000 | 15,200,000 | 10,000,000 | 1,400 | 1,260 | 18,500 | 380,000 | Strong execution with 95.0% obligation rate and 92.0% expenditure rate — ahead of schedule on budget absorption. Staffing fill rate of 90.0% is slightly below target. Outsourced leakage at 4.9% is within acceptable range. |
| Cedar Valley Clinic | Midwest | Division A | 75,000,000 | 68,200,000 | 62,400,000 | 5,800,000 | 6,800,000 | 650 | 598 | 7,500 | 145,000 | Responsible fiscal management with 90.9% obligation rate and 91.5% expenditure rate. Staffing fill rate of 92.0% and controlled outsourcing at 5.2% of service volume. Stable operations with effective cost containment. |
| Delta Medical Center | Pacific | Division B | 175,000,000 | 142,700,000 | 127,500,000 | 15,200,000 | 32,300,000 | 1,200 | 1,110 | 14,100 | 290,000 | Requires attention — obligation rate of 81.5% leaves $32.3M unobligated. Expenditure rate of 89.4% is acceptable. Staffing fill rate of 92.5% is strong. Recommend reviewing unobligated balance for potential reprogramming or year-end execution plan. |
Portfolio-Level Summary
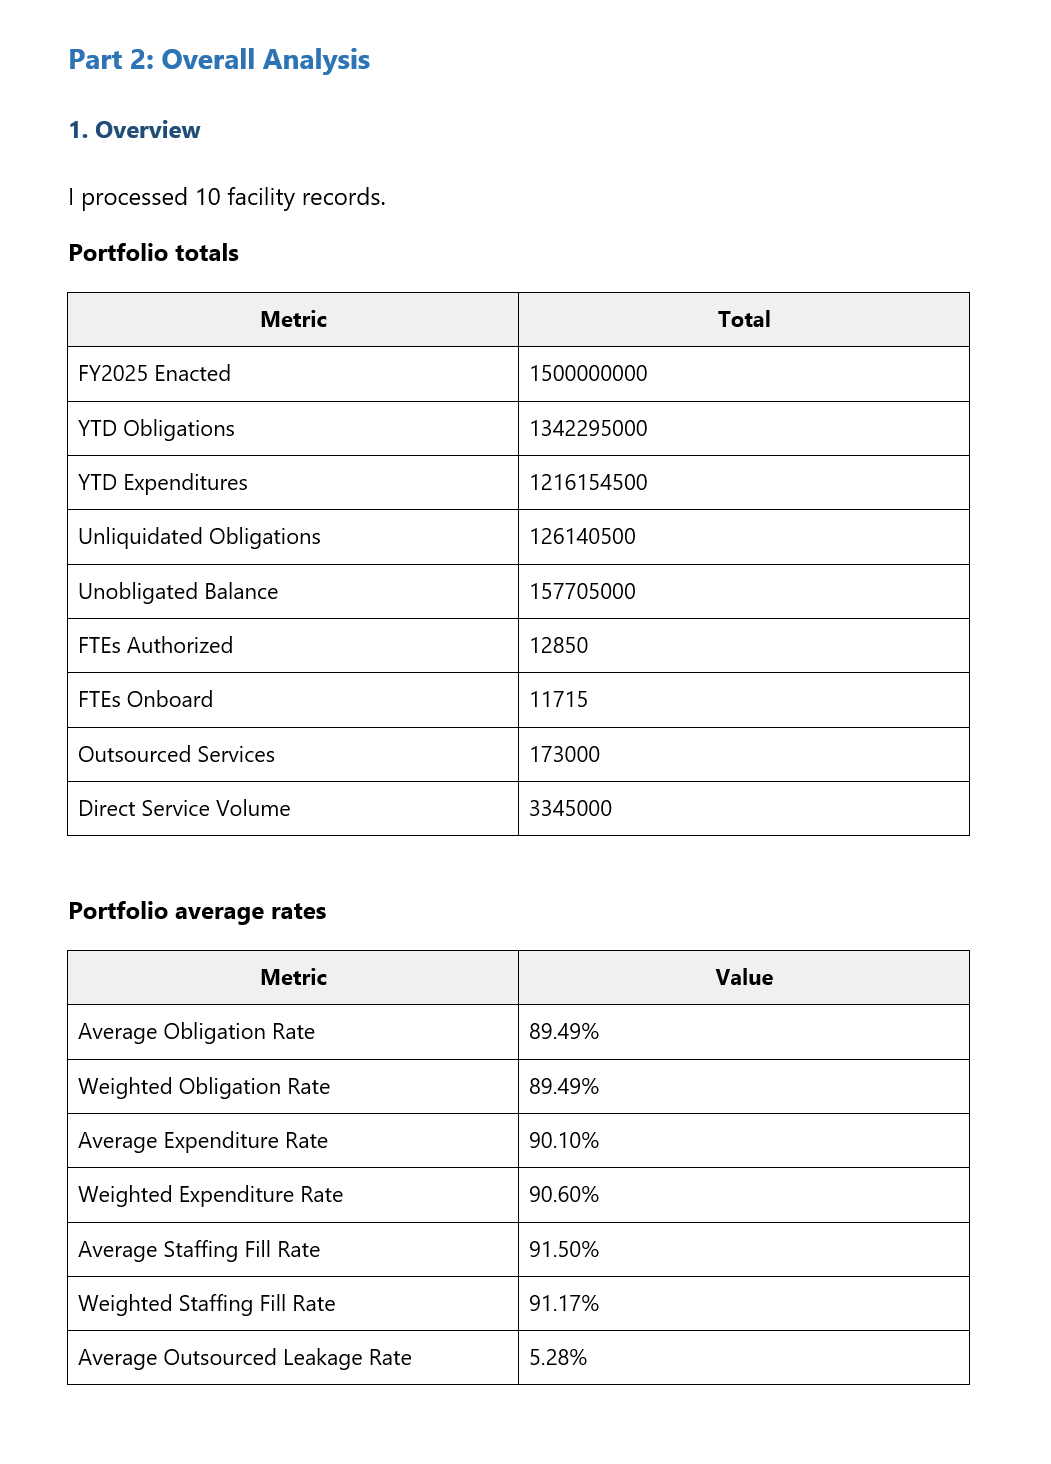
In addition to the row-by-row analysis, the workflow produces an overall summary with aggregated totals and computed averages across the entire dataset. The screenshot below is a sample — the full output includes top risks, top performers, trend analysis, and a portfolio-level recommendation.
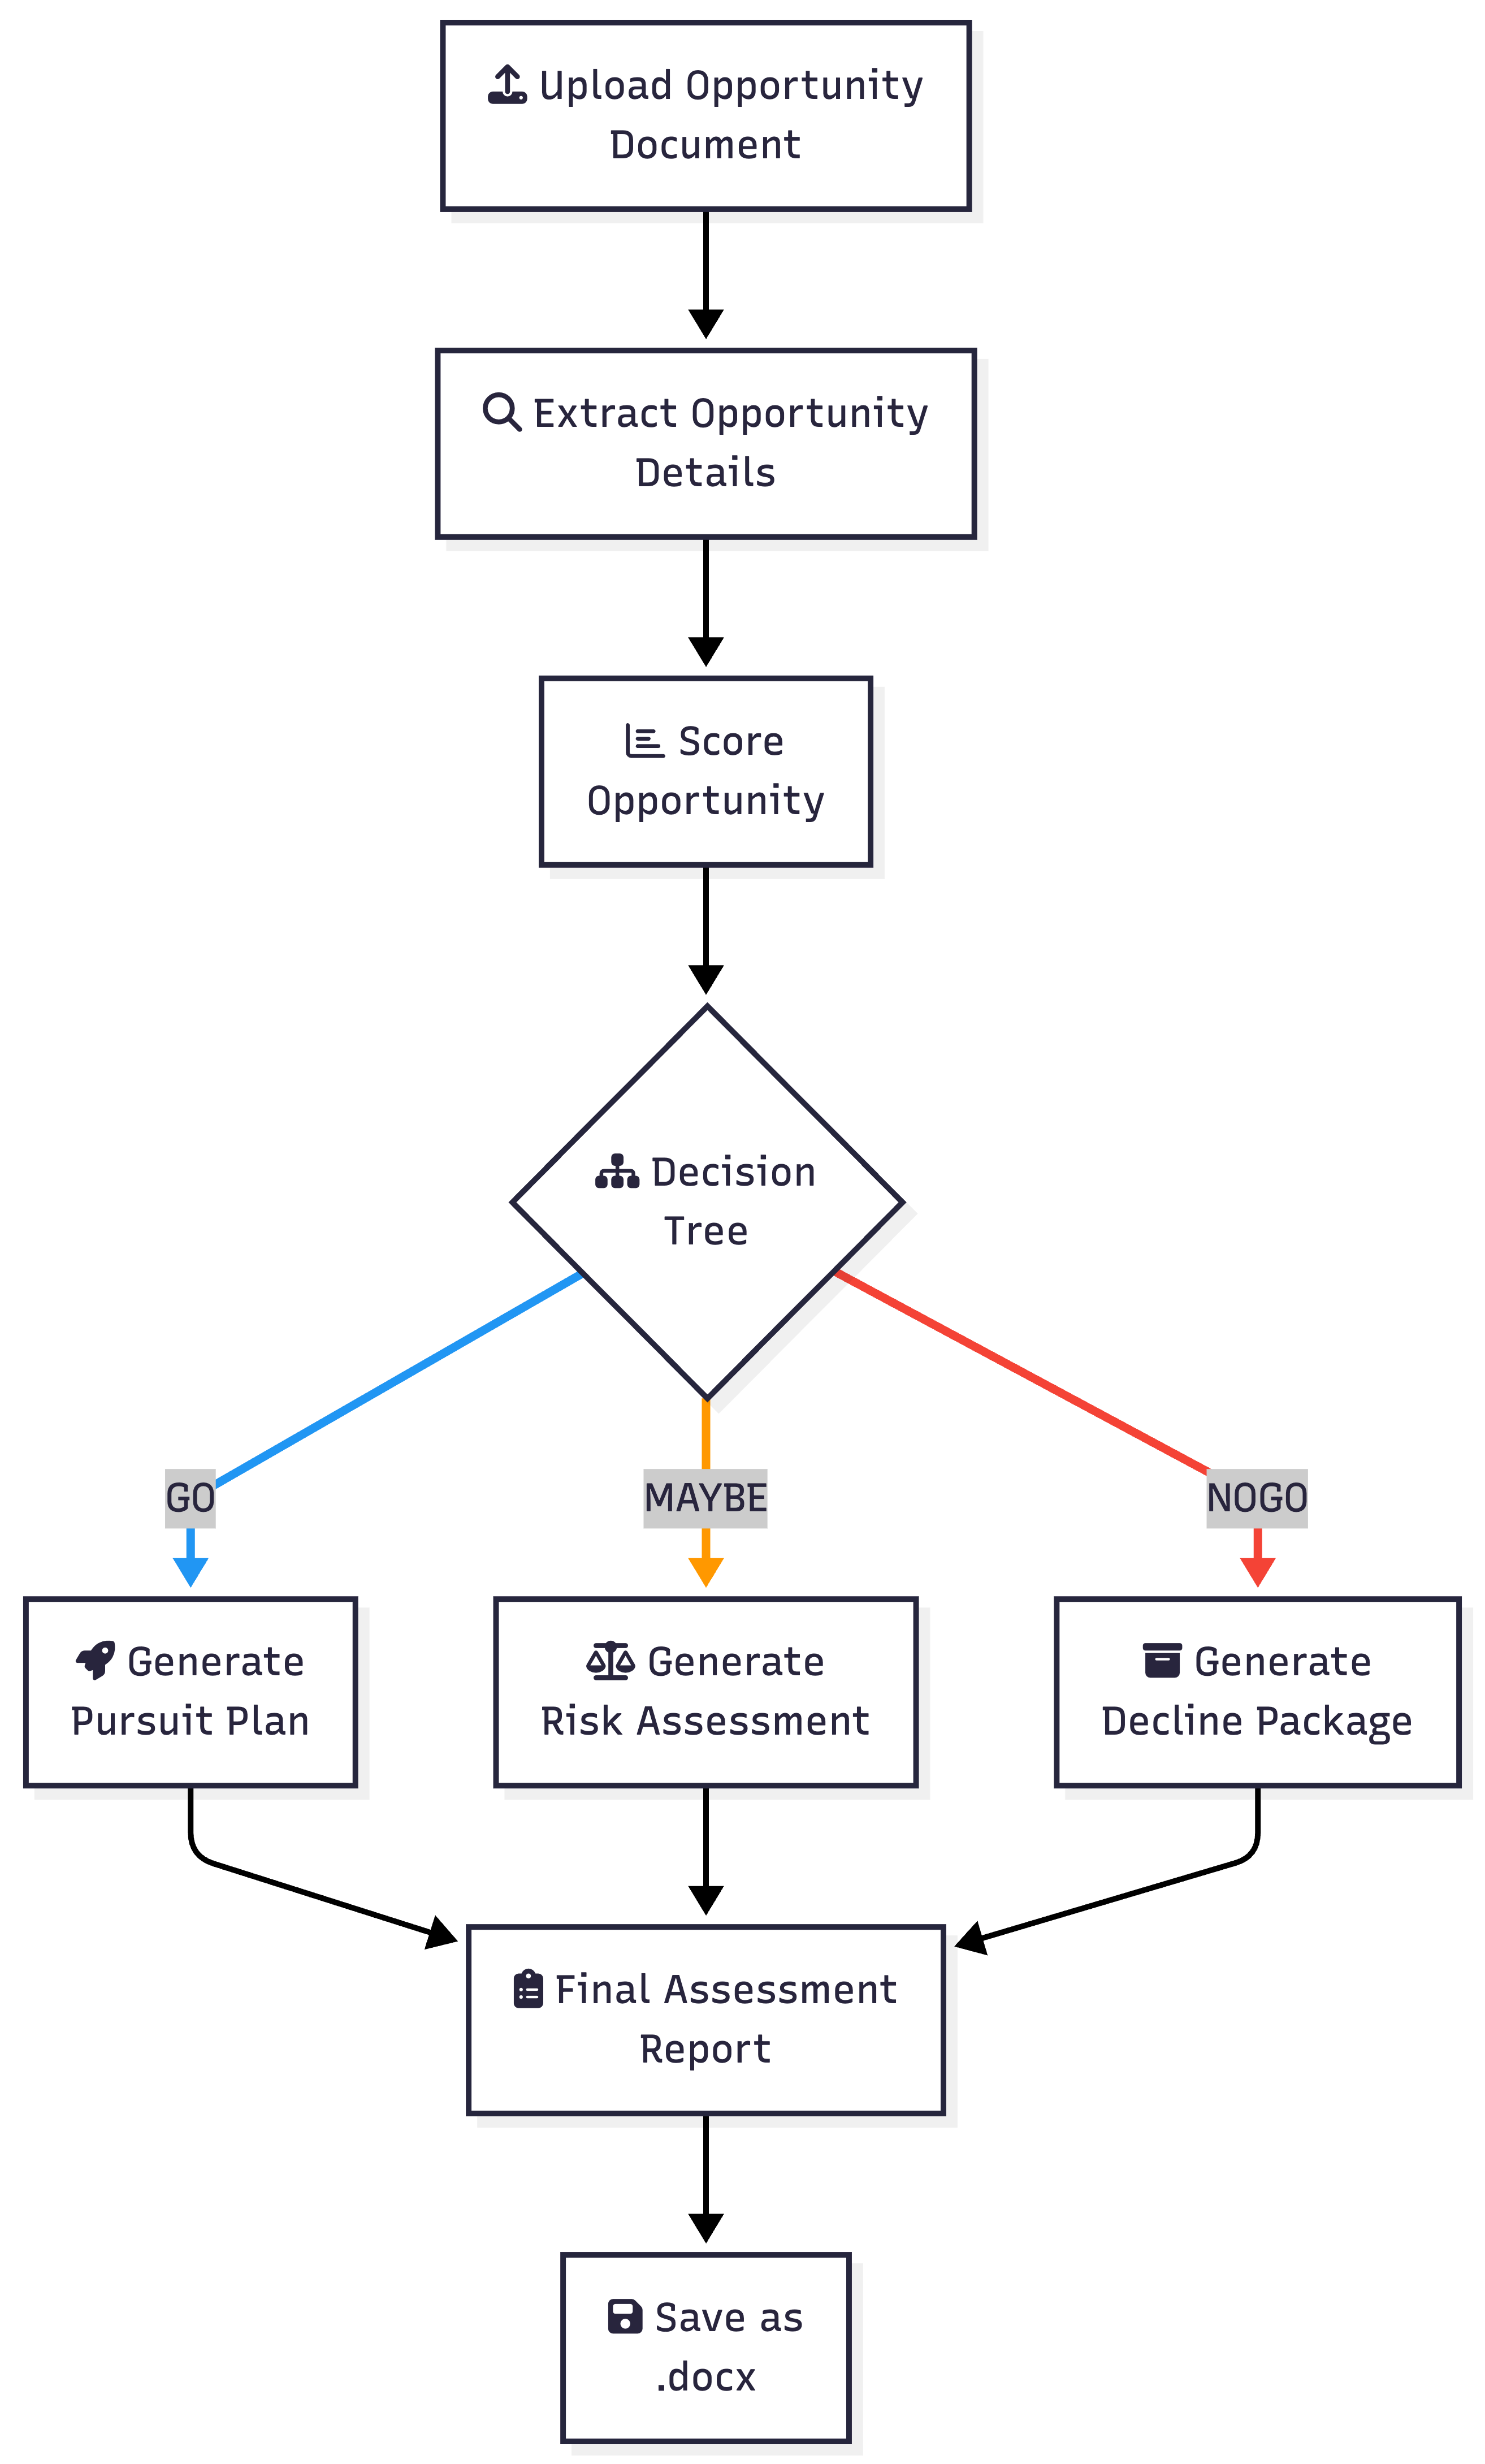
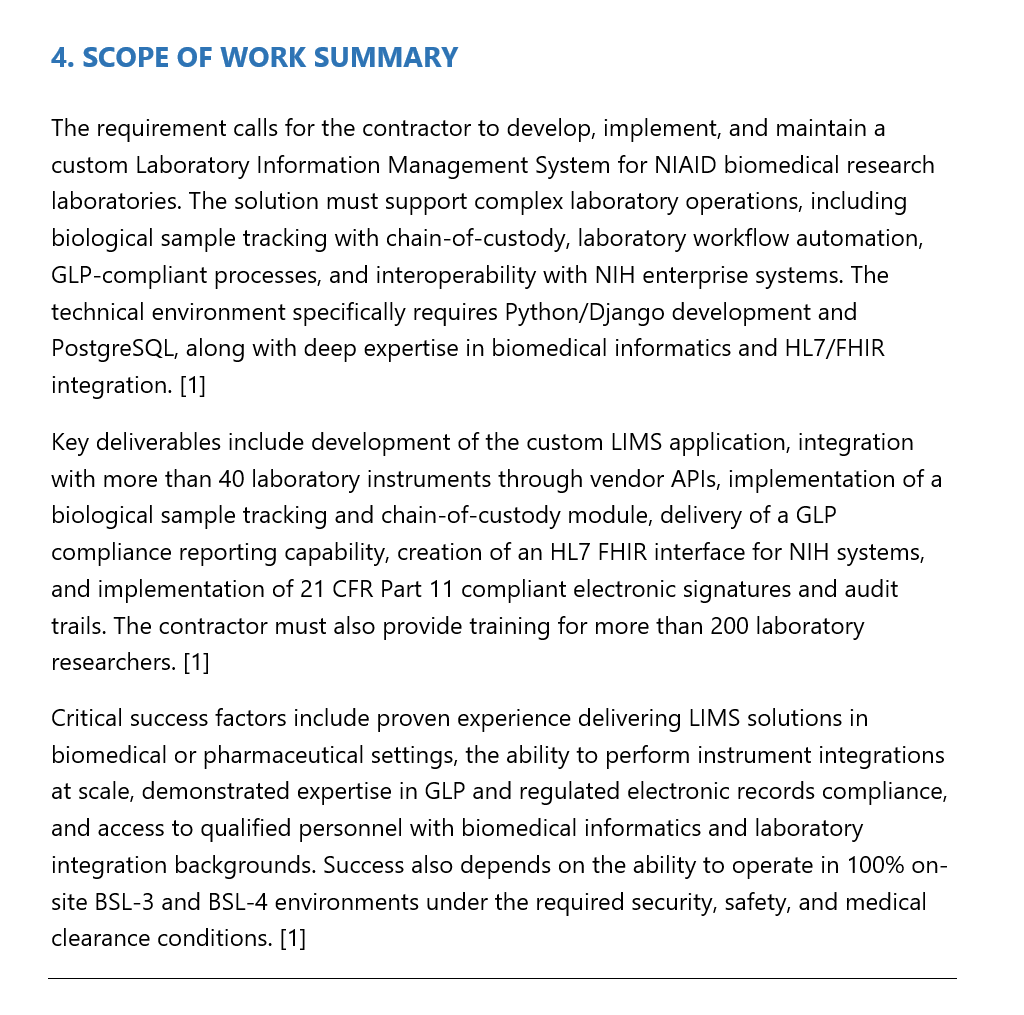
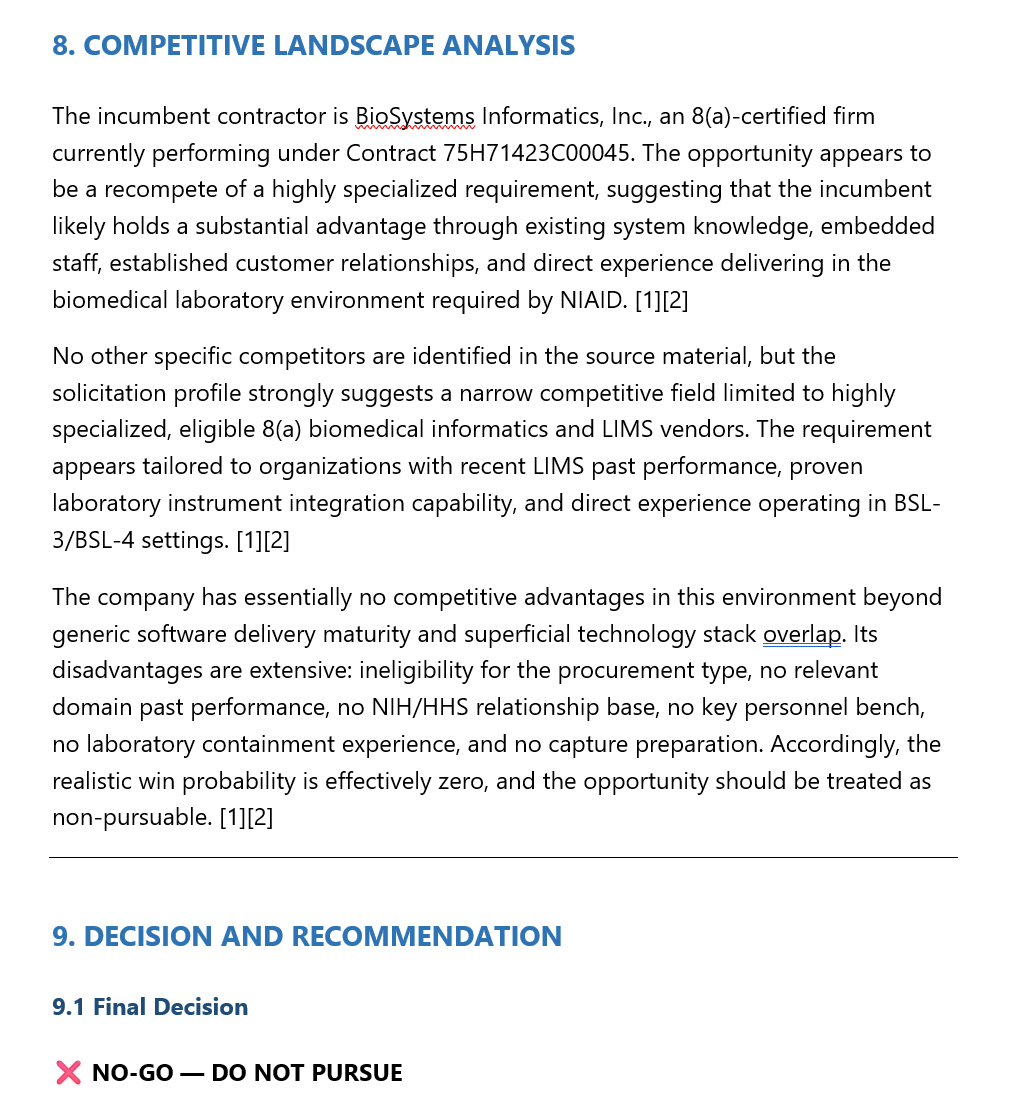
Automate your Go/No-Go decision process for government and commercial proposals. This workflow ingests opportunity documents alongside your company's capabilities, strategic priorities, and team capacity, then scores the opportunity across 10 weighted criteria and routes the result through a decision tree — automatically generating a tailored pursuit plan, risk assessment, or decline package depending on the outcome.
How It Works
The workflow uses a branching architecture — every opportunity follows the same intake and scoring pipeline, then a Decision Tree node routes execution down one of three paths based on the score.
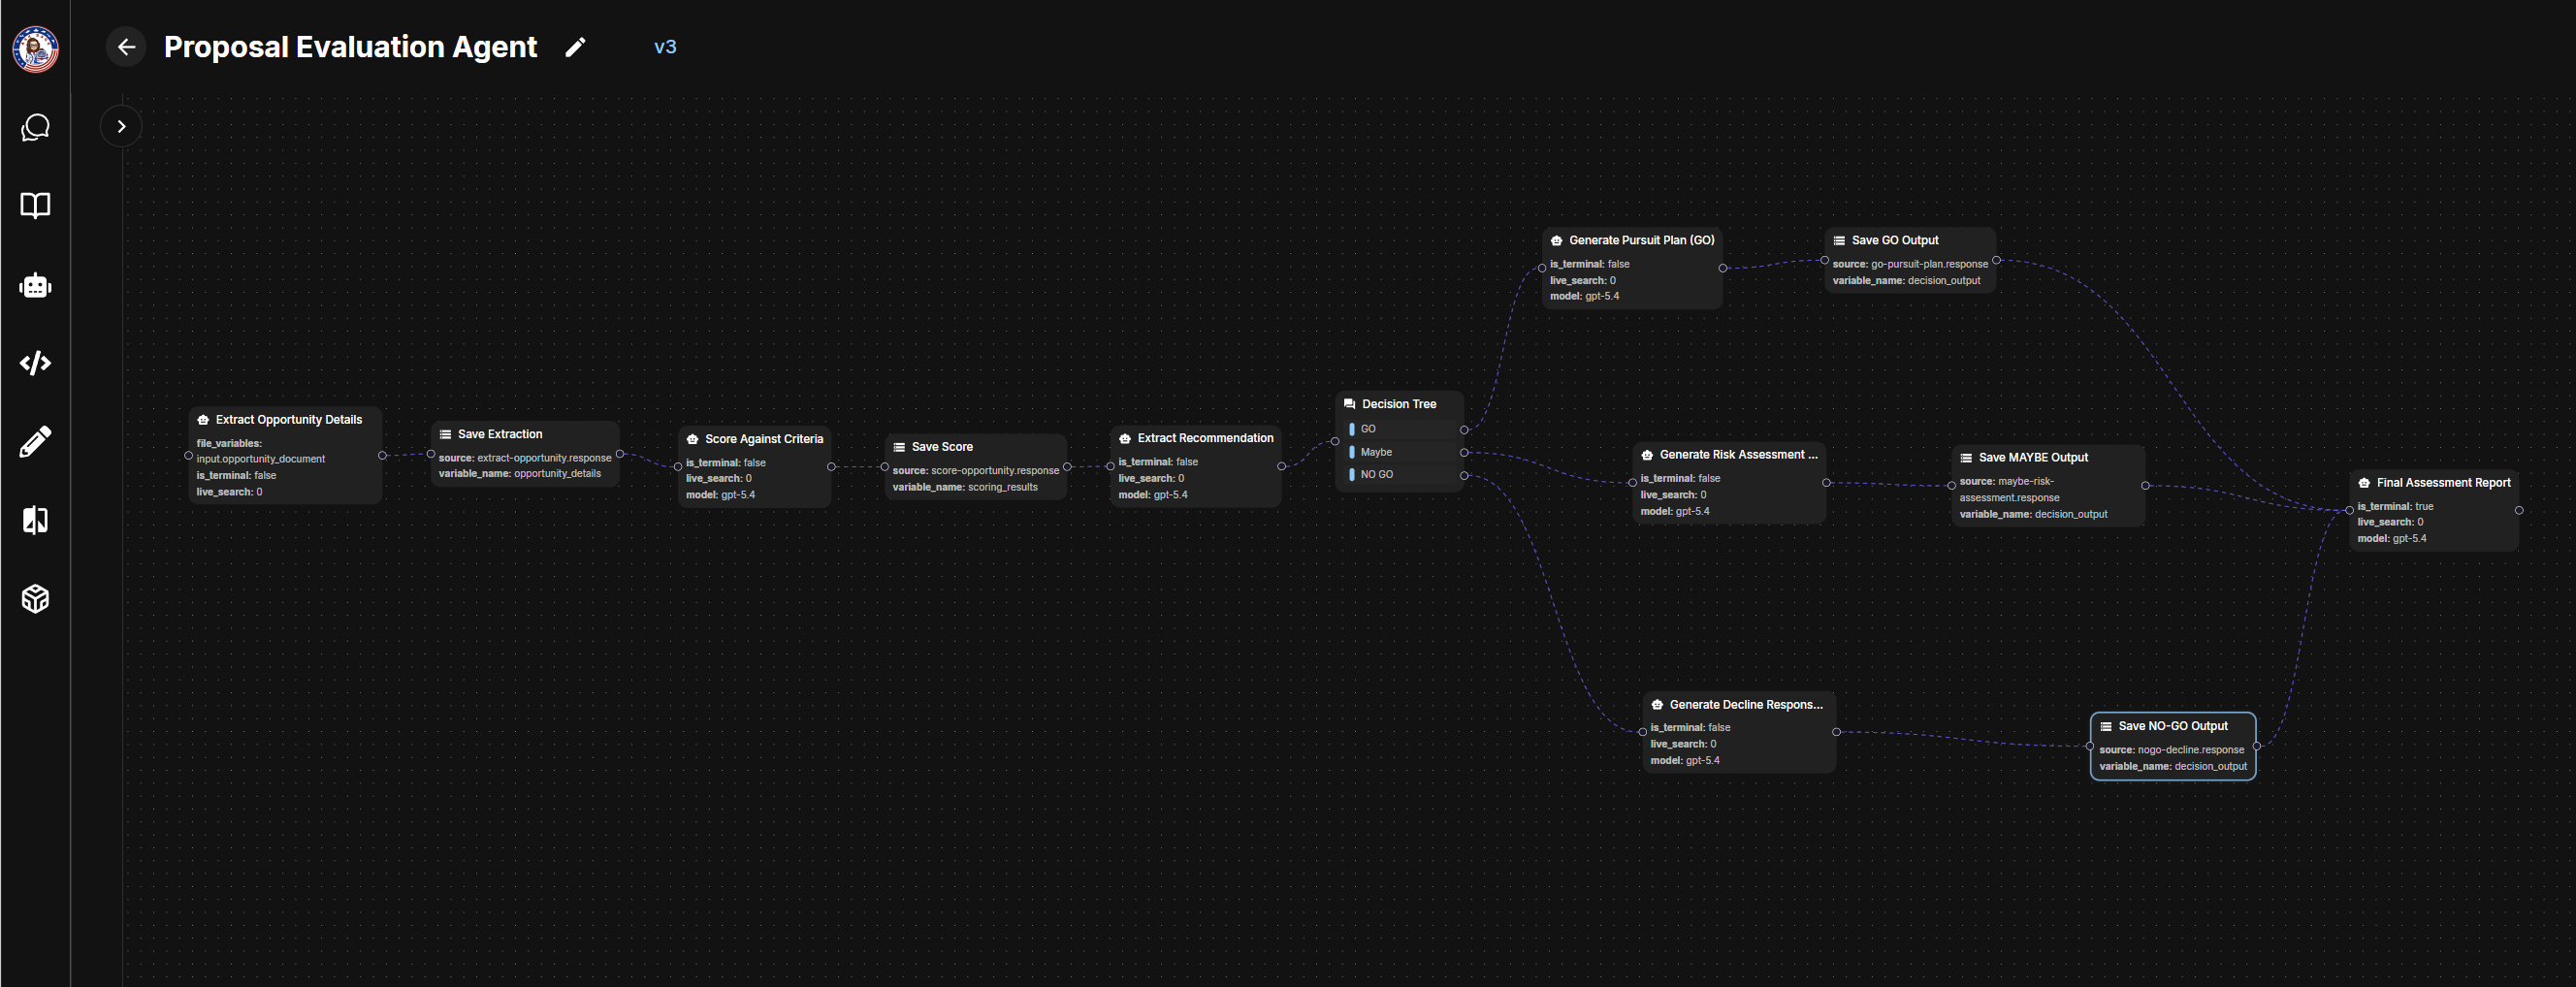
.docx. Workflow in Agent Builder
Below is the full node graph showing the branching architecture. After scoring, the Decision Tree routes to one of three LLM paths — each producing decision-specific output that feeds into the final report.
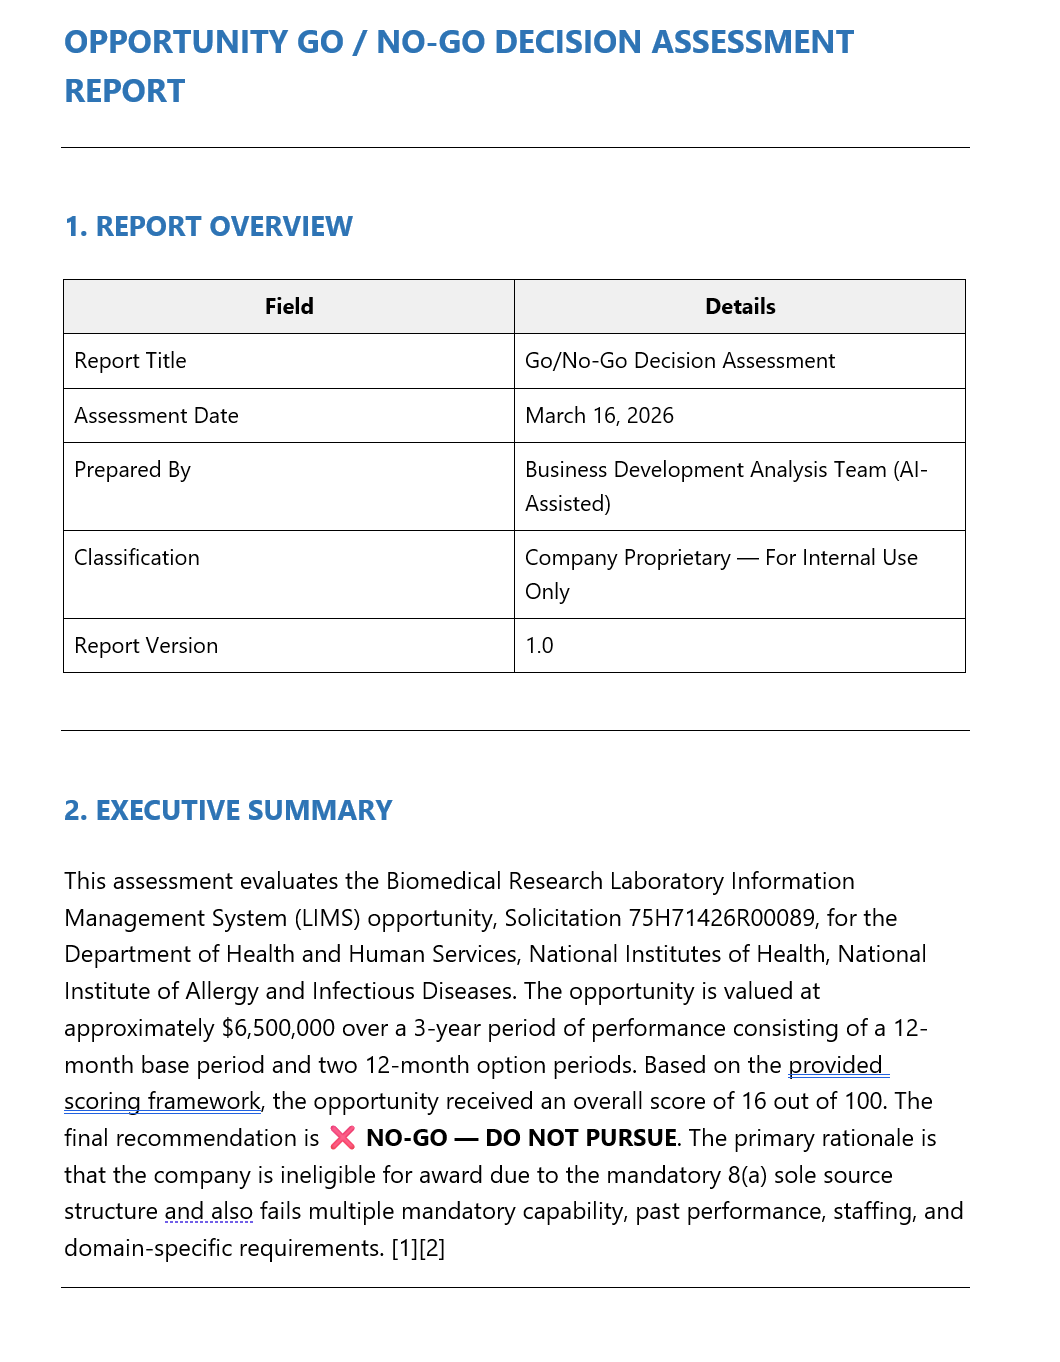
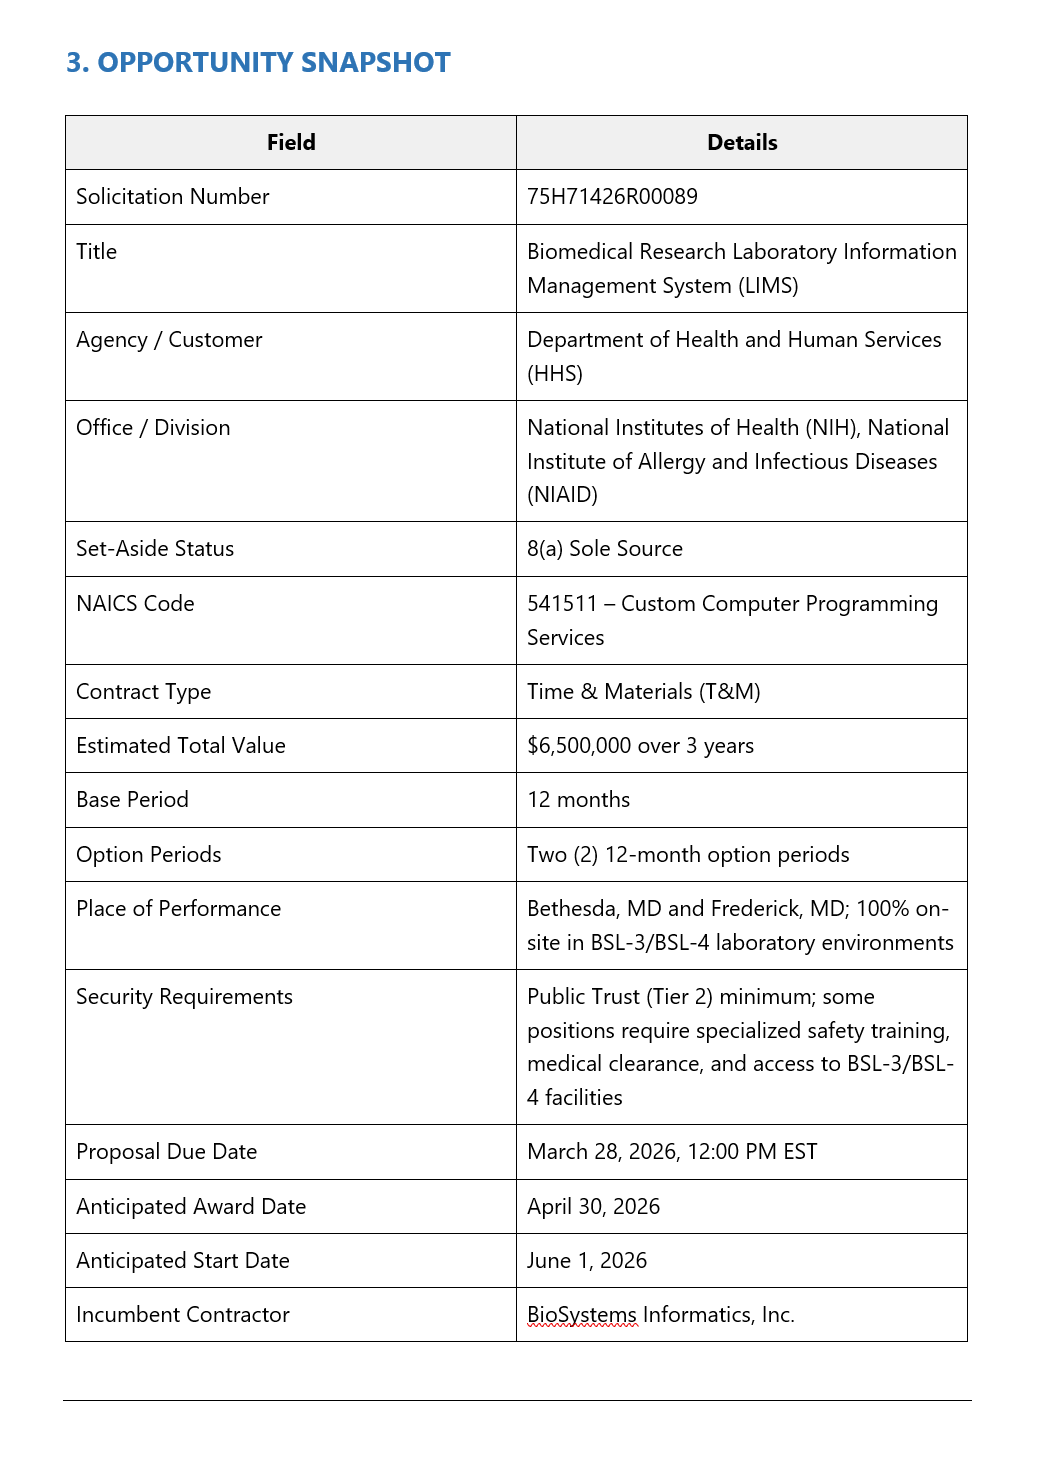
Sample Report Output
The agent produces a comprehensive assessment report covering the opportunity snapshot, executive summary, scope analysis, compliance matrix, scoring dashboard, competitive landscape, and a final Go/No-Go recommendation with action plan.
Customizable Inputs
The workflow accepts several variables so it can evaluate any opportunity against your specific organization:
| Variable | Description | Example |
|---|---|---|
opportunity_document | Upload the solicitation or RFP to evaluate | PDF or Word document from SAM.gov |
company_capabilities | Your organization's skills, certifications, and relevant experience | Core competencies, NAICS codes, clearances |
strategic_priorities | Current fiscal year goals and target markets | Grow DoD cloud portfolio to $100M+ |
team_capacity | Current proposal team availability and B&P budget | Proposal team committed through April |
incumbent_info | Intelligence on the current contractor (if recompete) | Incumbent name, contract value, performance |
evaluation_criteria | Custom scoring weights and thresholds | Eligibility compliance weighted 3x |
go_threshold | Minimum score to recommend GO (default: 80) | 80 |
maybe_threshold | Minimum score for MAYBE vs NO-GO (default: 50) | 50 |